Apoptosis: Analysis of Apoptosis by Flow Cytometry
Introduction
Flow cytometry is one of the most popular and versatile applications for studying apoptosis. It offers the ability to study large numbers cells individually rather than a mixed population, examining simultaneously the expression of many proteins like cell specific markers and indicators of apoptosis. Before starting your experiments it is important to note that apoptosis is not a static process and certain tests are time specific. For instance, if most of your cells are entering into late apoptosis you may not be able to detect early stages of apoptosis with some reagents. The powerful technique of flow cytometry can be used to both detect and quantify the level of apoptosis in a population of cells at static points or in a time course. However, flow cytrometry may not be the most appropriate application. Other applications such as western blotting or imaging may need to be used. Careful experimental set-up and interpretation of results will allow you to make the most of your experiment.
Flow cytometry allows the study of all aspects of apoptosis from induction via surface receptors, to late stages where DNA fragmentation occurs. Here we will walk you through specific flow cytometry assays with examples that will enable you to detect apoptosis. We will also give you tips to avoid common pitfalls and help you choose the right assay.
To help you plan and optimize your flow cytometry experiments download or request a copy of our Flow Cytometry Basics Guide.
Induction Phase of Apoptosis
While it is not possible to measure intrinsically mediated apoptosis induction by flow cytometry, measuring extrinsically mediated apoptosis induction is relatively straightforward as it involves the analysis of the so-called death receptors (DR) CD95, CD261 (DR4), CD262 (DR5), CD120a, and CD120b, which can be detected using antibodies. Our Apoptosis Overview page goes into more detail about the two main apoptosis pathways.
Understanding the balance between death receptor expression patterns and anti-apoptotic mechanisms, signaling pathways and upregulation of these receptors is important in the fields of cancer, inflammation, tissue healing, transplantation and cell death. Flow cytometry is ideal to determine expression levels of these receptors in cell populations from various samples. Receptor levels e.g. CD95/FAS (Figure 1) can be determined in various cell types simply by FSC (forward) and SSC (side scatter)profiles where lymphocytes, monocytes and granulocytes can be identified. Alternatively specific lineage markers can be used like CD3 for T cells, CD19 for B cells and CD14 for monocytes in an immunophenotyping panel. This enables you to obtain information on the levels of induction of apoptosis in specific cells.
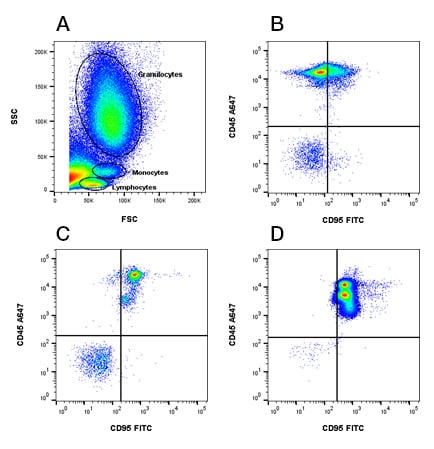
Fig.1. CD95 expression in peripheral blood populations. A, lymphocytes, monocytes and granulocytes in the live cell fraction were identified by FSC and SSC. The level of CD95 /FAS receptor (MCA1539FITC) was determined in B, lymphocytes, C, monocytes and D, granulocytes. To help with identification, cells were counterstained with CD45 (MCA87A647).
Table 1 below lists Bio-Rad’s death receptor antibodies validated in flow cytometry. Note that care should be taken when immunophenotyping apoptotic cells. Dead cells can bind antibodies non-specifically so a viability dye is a must to avoid false positives. Staining protocols may also need to be optimized. Long incubation times may alter the apoptosis levels and intracellular staining requires fixation and permeabilization of cells.
Table 1. Flow cytometry validated antibodies against receptors of the extrinsic apoptosis pathway.
| Receptor | Synonyms | Receptor Ligand | Positive Control | Top Clone | Citations | Further Information |
|---|---|---|---|---|---|---|
| CD95 | FAS | FasL CD178 | Human peripheral lymphocytes | LOB 3/17 | 12 | Soluble version of CD95 (sCD95) acts as a decoy receptor inhibiting apoptosis |
| CD262 | DR5 / TRAIL-R2 | DR5 | BJAB cells | DJR2-4 | 0 | |
| CD120a | TNF-R1 |
TNF-α |
Human peripheral granulocytes | H398 | 13 | |
| TNF-R2 | Soluble version of CD120b (sCD120b) acts as a decoy receptor inhibiting apoptosis | |||||
| CD266 | TNFRSF12A, TWEAKR | TWEAK | Heart, lung, kidney | ITEM-4 | 4 | Cross-reacts with mouse CD266 |
Early Phase of Apoptosis
The intrinsic and extrinsic pathways are separate at early stages of apoptosis, although it has been shown that active caspase-8 can activate truncated Bcl-2 homology 3 (BH3) interacting domain death agonist (tBid), leading to the induction of the intrinsic pathway. Flow cytometry can be used to distinguish apoptosis progression through each pathway helping you to determine an apoptosis mechanism.
Intrinsic pathway
Measurement of the early phase of intrinsically mediated apoptosis consists primarily of the examination of the B-cell lymphoma 2 (Bcl-2) family members by applications such as western blotting or immunohistochemistry although Bcl-2 can be detected by flow cytometry (Table 2), following an intracellular staining protocol. Detection of intracellular proteins by flow cytometry can be challenging as the cells have to be fixed and permeabilized prior to staining. This may require optimization and different controls. Visit our intracellular flow cytometry webpages for information on reagents and protocol tips and tricks.
Table 2. Flow cytometry validated Bcl-2 antibody.
Target |
Positive Control |
Top Clone |
Citations |
Catalog Number |
|---|---|---|---|---|
|
Jurkat cells |
100 |
11 |
MCA1550 |
Extrinsic pathway
After induction through the extrinsic pathway, the early phase of apoptosis can be easily detected by flow cytometry by examining the activity of the initiator caspases like caspase-8 and caspase-3/7.
Other signaling events, such as Fas-associated protein with death domain (FADD) binding and formation of the death induced signaling complex (DISC), are more often detected using western blotting as they also enable protein interactions to be measured (see our dedicated apoptosis western blotting page).
Although flipping of phosphatidyl serine (PS) can occur very early in apoptosis, it can be reversible until the depolarization of the mitochondrial membrane. Reversible PS flipping can be detected by fluorescence microscopy using our pSIVA Real-Time Apoptosis Kit. This kit contains a polarity-sensitive version of annexin B12 conjugated to the green emitting IANBD dye, which only fluoresces when bound to PS. For more information, go to our pSIVA Kit webpage. We discuss the exposure of PS on the extracellular surface and the reagents to detect in the mid phase section.
Caspase FLICA Kits measure apoptosis by detecting active caspases in live cells, thus the actual activity of the protease is detected. These kits are based on a unique cell-permeable and non-cytotoxic reagent called Fluorochrome Inhibitor of Caspases (FLICA). Each FLICA reagent has a specific caspase binding site of four amino acids, which can be changed. This allows different caspases to be detected. The FLICA Kit is easy, quick, reliable, and can be used with a wide range of viability dyes to distinguish between apoptotic and dead cells, a vital distinction when studying apoptosis. As can be seen in Figure 2 below, live cells do not stain with either FLICA or a viability dye. An apoptotic cell will be positive for FLICA and fluoresce at a specific wavelength depending on fluorophore, whilst excluding the viability dye. Cells that are dead will be positive for both FLICA and the viability dye.
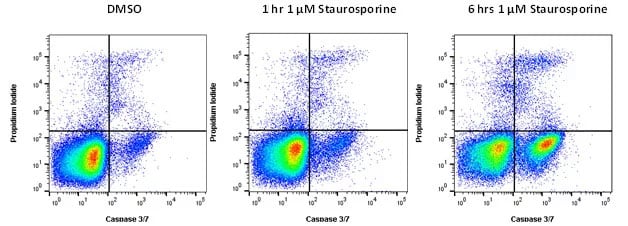
Fig. 2. Caspase activation during apoptosis. Jurkat cells were treated with staurosporine at 1 µM to induce apoptosis or DMSO as a control. Active caspases can be detected using FAM FLICA Caspase-3/7 Kit (ICT093) after 6 hr of treatment with dead cells determined using ReadiDrop™ Propidium Iodide (1351101). Data acquired on the ZE5™ Cell Analyzer.
Our Caspase FLICA Kits, to detect early apoptosis, are available conjugated to two different fluorophores to give you more flexibility in your viability dye choice, and allow easy incorporation into immunophenotyping panels (Table 3).
Table 3. Flow cytometry validated Caspase-3/7 and Caspase-8 Kits.
Description |
Format |
Optimal Laser Line (nm) |
Max Excitation (nm) |
Max Emission (nm) |
Catalog Number |
|---|---|---|---|---|---|
|
FAM (green fluorescence) |
488 |
492 |
518 |
ICT093 |
|
|
660 (red fluorescence) |
640 |
660 |
685 |
ICT9125 |
|
|
FAM (green fluorescence) |
488 |
492 |
518 |
ICT099 |
Mid Phase of Apoptosis
During the mid phase of apoptosis the two apoptosis pathways eventually converge, however it is still possible to distinguish between the intrinsic and extrinsic pathways using specific dyes and reagents, if a mechanism of apoptosis is required. Cellular changes during the mid-phase are often used to determine whether cell death is via apoptosis or necrosis as there is still membrane integrity allowing necrotic cells to be easily distinguished.
Intrinsic pathway mid phase
This phase is characterized by mitochondrial outer membrane permeabilization (MOMP). Following this, cytochrome c and apoptotic protease activating factor 1 (APAF-1) aggregate to form the apoptosome and caspase-9 is activated. This in turn activates caspase-3/7, and is the point where the intrinsic and extrinsic pathways converge. There are several flow cytometry reagents available to detect MOMP, caspase activation and PS flipping.
Measuring mitochondrial membrane potential
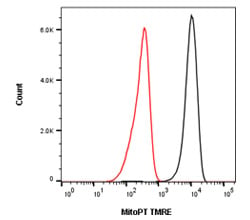
Fig. 3. Loss of mitochondrial potential during apoptosis. Jurkat T cells were treated with CCCP at 50 µM to induce apoptosis. A loss of membrane potential is reflected by the loss of fluorescence staining from the mitochondria as the dye escapes due to membrane disruption, using MitoPT TMRE Kit (ICT946). Data acquired on the ZE5 Cell Analyzer.
Insertion of the pro-apoptotic members of the Bcl-2 family into the mitochondrial membrane leads to the creation of pores. Pro-apoptotic molecules are released through these pores. However, in addition to this release, the pores also cause the collapse of the electrochemical gradient across the mitochondrial membrane. Changes in membrane potential indicate that a cell has passed the point of no return and is now committed to apoptosis. A collapse of the mitochondrial membrane potential can be detected by flow cytometry using potentiometric dyes.
Tetramethylrhodamine ethyl ester (TMRE), tetramethylrhodamine methyl ester (TMRM), and JC-1 are commonly used potentiometric dyes (Table 4). TMRE and TMRM aggregate in the mitochondria of non-apoptotic cells and fluorescence bright orange. In apoptotic cells with reduced mitochondrial membrane potential, these dyes leave the mitochondria and are found throughout the cytoplasm in their monomeric form, showing reduced fluorescence (Figure 3). JC-1 works slightly differently - its fluorescence emission wavelength varies as it changes from aggregates in mitochondria to monomers in the cytoplasm.
Table 4. Flow cytometry validated mitochondrial membrane potential assays.
Description |
Dye |
Optimal Laser Line (nm) |
Non-Apoptotic Cells |
Apoptotic Cells |
Catalog Number |
|---|---|---|---|---|---|
|
TMRE |
561 |
Orange fluorescence (573 nm) |
Weak orange fluorescence (573 nm) |
ICT946 |
|
|
Mitochondrial Membrane Potential Kit |
TMRM |
561 |
Orange fluorescence (574 nm) |
Weak orange fluorescence (574 nm) |
ICT948 |
|
JC-1 |
488 |
Red fluorescence (590 nm) |
Green fluorescence (527 nm) |
ICT943 and ICT944 |
Abbreviations: JC-1,
tetraethylbenzimidazolylcarboc
Caspases activated at this stage can be easily detected using the FLICA Kits described earlier (Table 5). The specific binding sequence LEHD allows caspase-9 to be detected, using both green and red fluorescence tags, allowing apoptosis from the mid phase of the intrinsic pathway to be monitored (Figure 4). Alternatively for detection of all active caspases, non-specific Poly Caspase FLICA Kits are also available. These kits detect all activated caspases allowing general apoptosis levels to be determined rather than specific pathways or stages of apoptosis. This can be useful if the kinetics of apoptosis in your sample has not been determined or if a simple “yes or no” answer is required rather than determining the mechanism. Again they are available with a range of fluorophores to easily fit into multicolor panels.
Table 5. Flow cytometry validated caspase-9 and poly caspase kits.
| Description | Format | Optimal Laser Line (nm) |
Max Excitation (nm) |
Max Emission (nm) |
Catalog Number |
|---|---|---|---|---|---|
| FAM FLICA Caspase-9 Kit | FAM (green fluorescence) | 488 | 492 | 518 | ICT912 |
| SR FLICA Caspase-9 Kit | Sulforhodamine (red fluorescence) | 561 | 560 | 590 | ICT960 and ICT961 |
| FAM FLICA Poly Caspase Kit | FAM (green fluorescence) | 488 | 492 | 518 | ICT091 |
| SR FLICA Poly Caspase Kit | Sulforhodamine (red fluorescence) | 561 | 560 | 590 | ICT916 |
| FLICA 660 Poly Caspase Kit | 660 (red fluorescence) | 640 | 660 | 685 | ICT9120 |
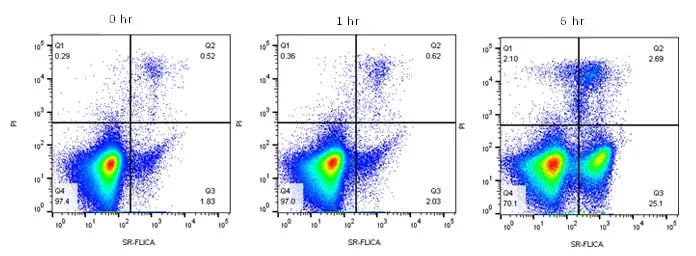
Fig. 4. Active caspase-9 staining to measure apoptosis by flow cytometry. Jurkat T cells were treated as shown with 6 µM camptothecin to induce apoptosis. The cells were then stained with Caspase-9 SR FLICA (ICT961) and ReadiDrop Propidium Iodide (1351101). Apoptotic cells positive for caspases can be seen in the bottom right quadrant and dead cells positive for both caspase and propidium iodide in the top right quadrant. Healthy cells are negative for both stains. Data acquired on the ZE5 Cell Analyzer.
Annexin V assays are one of the most commonly used to detect apoptosis as they are easy-to-use, quick, require no fixation and allow a large number of cells to be analyzed at any one time. Annexin assays are ideal for single cell suspensions and therefore flow cytometry. Furthermore as they are available in a variety of conjugates (Table 6), they can be easily incorporated into multicolor panels allowing the detection of apoptosis in specific cell lineages or subsets giving a quick “yes or no” answer in seconds. The assays rely on the ability of annexin V to bind to the membrane phospholipid PS exposed at the cell surface during the early to mid stages of apoptosis and, when used in combination with a viability dye, apoptotic from necrotic cells can be distinguished.
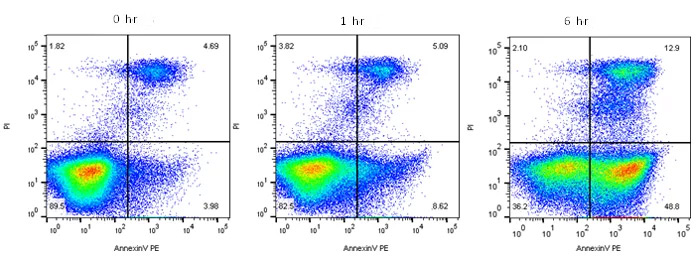
Fig. 5. Annexin V staining to measure apoptosis by flow cytometry. Jurkat T cells were treated as shown with staurosporine at 1
µM
to induce apoptosis. The cells were then stained with annexin V PE (ANNEX200PE) and ReadiDrop Propidium Iodide (1351101). Apoptotic cells positive for annexin V can be seen in the bottom right quadrant and dead cells positive for both annexin and PI in the top right quadrant. Healthy cells are negative for both stains. Data acquired on the ZE5 Cell Analyzer.
Table 6. Flow cytometry validated Annexin V Assay Kits.
Kit |
Optimal Laser Line |
Max Excitation |
Max Emission |
Catalog Number |
|
|---|---|---|---|---|---|
|
N/A |
N/A |
N/A |
ANNEX20B, ANNEX100B and ANNEX300B |
||
|
488 |
490 |
525 |
ANNEX20F, ANNEX100F and ANNEX300F |
||
|
488 or 561 |
496/546 |
578 |
ANNEX50PE and ANNEX200PE |
||
|
640 |
650 |
661 |
ANNEX50APC and ANNEX200APC |
||
FLISP Serine Protease Detection Kits
Fluorescent Labeled Inhibitors of Serine Protease (FLISP) Kits allow the detection of intracellular chymotrypsin-like activity of serine proteases in live cells. Thought to be activated downstream of caspases, serine proteases are more active in apoptotic cells and can therefore be used as a method to detect general levels of apoptosis. The kits contain a FAM labeled inhibitor probe that covalently binds to active serine proteases within the cell. Different serine proteases can be detected depending upon the probe used.
Cathepsin B Kits
Bio-Rad offers Green Cathepsin B Kits for analysis of active cathepsins in whole, live cells by flow cytometry utilizing a substrate based assay. These kits enable the detection of active cathepsins contained in lysosomes, which are involved in the autophagy pathway and phagocytosis. When released into the cytoplasm, they can regulate both the apoptosis extrinsic and intrinsic pathways.
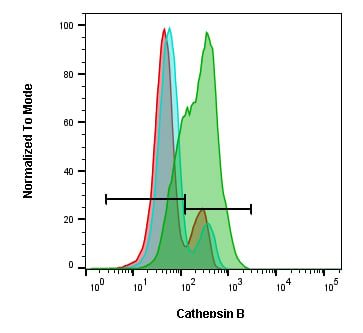
Fig. 6. Cathepsin B staining in Jurkat T cells after treatment with inhibitors. Jurkat cells were treated with 10 μM CA-074 Me (blue histogram), 10 μM leupeptin (red histogram) or were untreated (green histogram). They were then stained with Green Cathepsin B Kit (ICT9152). The samples were analyzed by flow cytometry using a ZE5 Cell Analyzer.
The kit contains rhodamine 110 coupled to two copies of the amino acid sequence arginine-arginine which is non-fluorescent. When enzymatically cleaved by cathepsin, rhodamine 110 fluoresces at 525 nm when excited at 500 nm. Use a 488 nm laser and a FITC (525/35 nm) filter to detect active cathepsin B in live cells.
Kits for cathepsin B, K, and L are also available conjugated to Magic Red.
Late Phase of Apoptosis
The easiest and simplest way to measure cell morphological changes using flow cytometry is by looking for changes in the forward (FSC) and side scatter (SSC). As cells progress through apoptosis both FSC and SSC reduce, whereas necrotic cells initially swell before bursting. FSC and SSC will not always allow you to distinguish between apoptotic and necrotic cells however, so caution should be used with this method. Using a microscope will allow you to detect cell morphological changes more accurately. In addition to morphological changes, the late phase of apoptosis can also be characterized by DNA fragmentation.
DNA fragmentation can be visualized by flow cytometry using DNA binding dyes such as PI, 7-AAD, DAPI and Hoechst 33342 (Table 7). Cells in the late phase of apoptosis can be fixed and permeabilized using 70% ethanol. This permeabilization results in the 182bp DNA fragments, created during the late phase, leaking out of the cells. Therefore these cells will have less DNA and when stained with a DNA binding dye, less fluorescence than normal. When represented on a DNA profile plot, usually represented on a linear scale, these cells appear as a sub G1 population (Figure 7). Remember, if you are using a dye which binds DNA and RNA, pretreatment with RNAse may be required to accurately measure DNA.
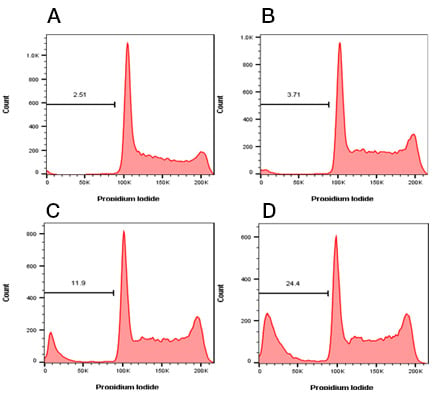
Fig. 7. Sub G1 or Nicoletti Assay. Jurkat T cells were treated with staurosporine at 1 µM to induce apoptosis. The cells were then fixed in cold 70% ethanol followed by staining with ReadiDrop Propidium Iodide (1351101) to determine the level of sub G1 cells. A, untreated cells have a low frequency of sub G1 cells which increases after B, 2 hr, C, 4 hr and D, 8 hr treatment. Data acquired on the ZE5 Cell Analyzer.
Whilst this assay is quick and easy to perform it gives no indication of the mechanism or process of apoptosis itself. A lack of a sub G1 peak does not necessarily mean there is no apoptosis in your cell population. The sample and stage of apoptosis used may influence your results. If the cells have not lost enough DNA, you will not be able to distinguish apoptotic from live G1/G0 cells. Furthermore if your apoptotic cells are aneuploid, their sub G1 peak may not be visible and you won’t be be able to distinguish between sub G1 populations as a result of other forms of cell death.
Table 7. DNA binding dyes.
Reagent |
Optimal Laser Line |
Max Excitation |
Max Emission |
Catalog Number |
|---|---|---|---|---|
|
355, 488 or 561 |
305/490 |
617 |
1351101 |
|
|
488 or 561 |
546 |
647 |
1351102 |
|
|
355 or 405 |
359 |
461 |
1351303 |
|
|
355 or 405 |
350 |
461 |
1351304 |
As we have shown, there are a myriad of ways to detect apoptosis with many reagents available that allow specific mechanisms, time-points and pathways to be analyzed. We have summarized the flow cytometry antibodies, kits and reagents that can be used at each time-point in Table 8 below.
Table 8. Overview of flow cytometry antibodies, kits and reagents suitable for apoptosis detection.
Early Apoptosis |
|---|
Late Apoptosis |
|---|
Detecting Apoptosis by Flow Cytometry – helpful tips and tricks
Whilst detection of apoptosis can be relatively straightforward, once the right assay has been chosen, making sense of the data can prove challenging.
Accurate gating of your cell population is very important due to changes in cell morphology which occur during apoptosis. The position of a forward and side scatter gate can drastically alter your results. This can be clearly seen in Figure 8 below, where healthy and apoptotic Jurkats have been stained with annexin V and PI. Using gate A, a high level of dead cells for both treated and untreated can be seen, whereas using gate B reveals the apoptotic cells that have not started to die, in the treated experiment.
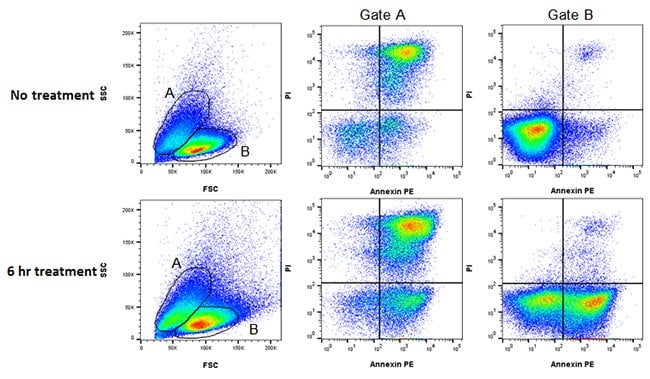
Fig. 8. Gating strategy in apoptosis. Jurkat T cells were treated as shown with staurosporine at 1 µM to induce apoptosis. The cells were then stained with annexin V PE (ANNEX200PE) and ReadiDrop Propidium Iodide (1351101). Apoptotic cells positive for annexin V can be seen in the bottom right quadrant and dead cells positive for both annexin and PI in the top right quadrant. Healthy cells are negative for both stains. The levels of apoptotic cells and dead cells vary depending on which FSC and SSC gate is used. Data acquired on the ZE5 Cell Analyzer.
Apoptosis is a kinetic event that can change depending upon the cell type, apoptotic inducer and cell cycle. Don’t assume the percentage of cells positive for an apoptotic marker directly correlates to the percentage of cells undergoing apoptosis. The levels of proliferation and the time taken to progress through apoptosis may vary. Quick progression would mean you may only detect a few apoptotic cells even though there is a lot of apoptosis, whereas a slow progression would result in more positive cells. Counting the absolute number of cells in apoptosis relevant to controls can be a more accurate way of determining the level of apoptosis.
The type of sample used will influence which apoptosis assays are available to you. Non adherent cells require little processing compared to adherent cells and the process of trypsinization or ficoling can lead to an increase in apoptotic or dead cells. For solid tumors and sections, although single cell suspensions can be prepared, flow assays may not be the most suitable and alternative assays such as western blotting and imaging should be considered. Whatever the application you choose to do, always have a viable control sample and a positive control if possible, as a reference, to confirm apoptosis.
As with all flow cytometry experiments, a good understanding of the filters and lasers on your cytometer is crucial to avoid wasting precious samples and reagents. Apoptosis and cell death often lead to increased levels of autofluorescence therefore controls are crucial to apoptosis experiments. As with all fluorescent experiments using two or more colors, compensation may be required so ensure single stained controls are included.
Confirmation of apoptosis may necessitate several different reagents to be used, particularly if specific mechanisms and pathway members are being studied. Finally, it is always best to analyze your samples as soon as possible to avoid increased apoptosis or necrosis as a result of samples sitting on the bench or in the fridge for long periods of time.
Find more in-depth information on apoptosis by clicking on the links below.


