Anti-Biotherapeutic Antibody Quality Control and Characterization
Overview
Reproducibility and accuracy are essential for successful bioanalytical assay development. We understand that the antibodies for these assays must be made to a high specificity, high quality and supplied to a consistent standard in order to minimize assay variability, so that you can have confidence in your results.
We use the HuCAL® recombinant monoclonal antibody library and an improved, proprietary method of antibody phage display to generate fully human anti-biotherapeutic antibodies in Fab and full length immunoglobulin (Ig) formats for bioanalytical assays. Integral to the process is in vitro guided selection, which enables the generation of highly specific inhibitory and non-inhibitory anti-idiotypic antibodies and specialized drug-target complex binders. The antibody sequence is always known and stored for long term security and our methods are well established, proven and highly reproducible.
Every new antibody and subsequent batches (‘lots’) are subject to a strict quality control (QC) procedure, to make sure that you receive a high quality product every time. This helps you manage the life cycle, characterization and supply of your critical reagents and maintain optimal assay performance over time.
The following examples give insight into the analytic methods we apply at Bio-Rad in our quality control procedures and for analytical antibody batch characterization as part of the product development for our anti-biotherapeutic antibody portfolio.
Quality Control
Batch to batch consistency
For reagents in full length Ig format, the antibody batches are tested and compared using an anti-drug antibody (ADA) bridging ELISA set-up. Figure 1 shows batch consistency with an anti-palivizumab antibody as an example for such an assay.

Fig. 1. Batch to batch consistency. A microtiter plate was coated over night with palivizumab at a concentration of 1 µg/ml. After washing and blocking with PBST + 5% BSA, PBST with 10% human serum, spiked with increasing concentrations of human anti-palivizumab antibody (HCA262, Lot 1-4) was added. Detection was performed using HRP conjugated palivizumab at a concentration of 2 µg/ml in HISPEC assay diluent (BUF049A) and QuantaBlu™ fluorogenic peroxidase substrate. HRP conjugation of palivizumab was performed using a LYNX Rapid HRP Antibody Conjugation Kit®. Data are shown as the mean of three measurements for each data point. EC50 values (table on right) were calculated from the non-linear curve fits.
Quality control for batch release
Every new product is first produced in 3 independent batches. The activity of the batches is compared in a ligand binding assay: ELISA titration for Fab antibodies (figure 6), ADA bridging ELISA for Ig antibodies (figures 1 and 7). The batch closest to the average curve is chosen as the future reference batch. Every new batch is compared to the reference batch using the same assay protocol.
Before release, new batches of all antibodies are also routinely tested for specificity, purity (figures 2 and 3), and full length Ig antibodies are tested by SEC for monodispersity (figure 4). In addition, for each new batch production, the antibody gene is re-sequenced to ensure product identity.
SDS PAGE
Purity of Fab format antibodies is assessed using SDS PAGE with subsequent Coomassie staining, figure 2.

Fig. 2. Purity assessment of Fab format antibodies. Human anti-trastuzumab (HCA167), anti-bevacizumab (HCA182), and anti-infliximab (HCA212) Fab antibodies were analyzed by SDS-PAGE (2 µg per lane). Heavy chains (H) and light chains (L) are visible at ~32 kDa and ~28 kDa, respectively.
Capillary electrophoresis (CE)
Purity of full immunoglobulin format antibodies is assessed using capillary electrophoresis (CE); the output is a ‘virtual’ gel, as shown in figure 3.

Fig. 3. Purity assessment of Ig format antibodies. Three different batches of human anti-palivizumab hIgG (HCA262, Lot 1-3) were analyzed by CE. Samples were denatured and run under reducing and non-reducing conditions. Heavy chains (H) and light chains (L) under reducing denaturing conditions are visible at ~50 kDa and ~30 kDa, respectively. Intact IgG molecules (H2L2) are visible at ~150 kDa under non-reducing denaturing conditions.
Size exclusion chromatography (SEC)
SEC is used to look for the presence or absence of aggregates, figure 4.

Fig. 4. SEC analysis. Three different batches of human anti-palivizumab hIgG (HCA262, Lot 1-3) were analyzed by SEC.
General Antibody Characterization
Long term stability
Antibody shelf life stability can be tested by using an accelerated stability testing protocol or by monitoring activity after several freeze-thaw cycles. In the example below, the anti-bevacizumab antibody HCA185 (human IgG1) was tested by measuring activity after up to 14 days incubation at 37°C.

Fig. 5. Accelerated stability test. Freshly thawed human anti-bevacizumab hIgG (HCA185) was diluted to 1mg/ml, aliquoted and placed at 37°C. Aliquots were removed from 37°C at every time point and placed at 4°C along with the control. For the assay a microtiter plate was coated over night with bevacizumab at a concentration of 1 µg/ml. After washing and blocking with PBST + 5% BSA, PBST with 10% human serum, spiked with increasing concentrations of human anti-bevacizumab hIgG (HCA185) was added. Detection was performed using HRP conjugated bevacizumab at a concentration of 2 µg/ml in HISPEC assay diluent (BUF049A) and QuantaBlu fluorogenic peroxidase substrate. HRP conjugation of bevacizumab was performed using a LYNX Rapid HRP Antibody Conjugation Kit. Data are shown as the mean of three measurements. EC50 values (table on right) were calculated from the non-linear curve fits.
In the example below, two independent batches of the anti-adalimumab antibody HCA202 (Fab format) were tested for activity after several freeze-thaw cycles using indirect ELISA, figure 6.

Fig. 6. Freeze-thaw test for Fab format. Human anti-adalimumab Fab-FH antibody (HCA202) lot 1 (left) and lot 2 (right), were subjected to the indicated number of freeze-thaw cycles (FT). For the assay a microtiter plate was coated over night with adalimumab at a concentration of 5 µg/ml. After washing and blocking with PBST + 5% BSA, PBST with 10% human serum, spiked with increasing concentrations of human anti-adalimumab Fab-FH antibody was added. Detection was performed using HRP conjugated anti-His-tag antibody (MCA5995P) at a dilution of 1:2000 in HISPEC assay diluent (BUF049A) and QuantaBlu fluorogenic peroxidase substrate. Data are shown as the mean of three measurements. EC50 values (tables under graphs) were calculated from the non-linear curve fits.
Similarly, two independent batches of the anti-adalimumab antibody HCA204 (human IgG1) were also tested for activity after freeze-thaw cycles, this time using an ADA bridging ELISA set-up, figure 7.

Fig. 7. Freeze-thaw test for Ig format. Human anti-adalimumab hIgG1 (HCA204) lot 1 (left) and lot 2 (right), were subjected to the indicated number of freeze-thaw cycles (FT). For the assay a microtiter plate was coated over night with adalimumab at a concentration of 1 µg/ml. After washing and blocking with PBST + 5% BSA, PBST with 10% human serum spiked with increasing concentrations of human anti-adalimumab hIgG was added. Detection was performed using HRP conjugated adalimumab at a concentration of 2 µg/ml in HISPEC assay diluent (BUF049A) and QuantaBlu fluorogenic peroxidase substrate. HRP conjugation of adalimumab was performed using a LYNX Rapid HRP Antibody Conjugation Kit. Data are shown as the mean of three measurements. EC50 values (tables under graphs) were calculated from the non-linear curve fits.
Antibody affinity measurement
Affinity is the strength of binding between an antigen and an antibody binding site. The equilibrium dissociation constant between the antibody and its antigen is designated KD and is the ratio of the experimentally measured off- and on- rates, kd and ka, respectively. The lower the KD value, the higher the affinity of the antibody. We determine the affinity of all anti-biotherapeutic antibodies in their monovalent format using biolayer interferometry. Examples are shown below for an inhibitory anti-idiotypic antibody (Figure 8) and a specialized drug-target complex specific antibody (Figure 9). We use the monovalent Fab format for affinity determination, as the measured affinity truly reflects the intrinsic antigen-binding affinity due to the monovalent interaction with the antigen. Knowing the affinity of an antibody can give the assay developer an indication of the sensitivity of an assay that might be achieved.
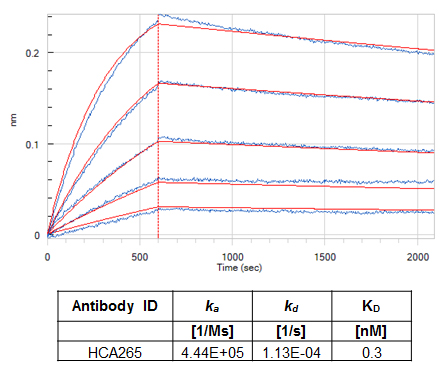
Fig. 8. Affinity determination for an inhibitory (Type 1) anti-idiotypic antibody. 10 µg/ml panitumumab in 10 mM sodium acetate pH 4 was immobilized on Octet® RED384 (Pall FortéBio) AR2G sensors with a coating density of 1.4 +/- 0.1 nm. The human anti-panitumumab antibody (HCA265), in a monovalent Fab format was then perfused over the sensor surface using a 1:2 dilution series with a starting concentration of 6.25 nM. An additional sensor perfused with experimental buffer only was used as reference for compensating any baseline drifts. Sensors were regenerated after each cycle with 10 mM glycine pH 2.0. Experimental buffer was PBS pH 7.4, 0.1% (w/v) BSA and 0.02% (v/v) Tween-20®. The experiment was performed at 30°C with a shake speed of 1000 rpm. A 1:1 interaction model was used to fit the data using the FortéBio Data Analysis software 8.2.0.7. Measured data are shown in blue; interaction fit is shown in red. Calculated association and dissociation rates and the KD value are given in the table.
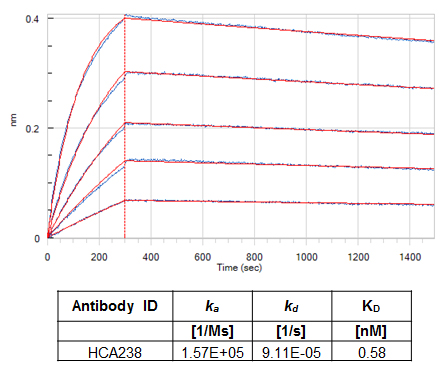
Fig. 9. Affinity determination for a drug-target complex specific (Type 3) antibody. 10 µg/ml omalizumab (anti-human IgE) in 10 mM sodium acetate pH 6 was immobilized on Octet RED384 (Pall FortéBio) AR2G sensors with a coating density of 2.8 ± 0.1 nm. The complex with human IgE (hIgE) was formed by adding 10 µg/ml of hIgE in experimental buffer. The additional signal of hIgE was 1.3 ± 0.1 nm. The hIgE/omalizumab complex-specific antibody (HCA238) in a monovalent Fab format was then perfused over the sensor surface using a 1:2 dilution series with a starting concentration of 48 nM. An additional sensor with immobilized omalizumab/hIgE complex and perfused with experimental buffer only was used as reference for compensating any baseline drifts. Experimental buffer was PBS pH 7.4, 0.1% (w/v) BSA and 0.02% (v/v) Tween-20. The experiment was performed at 30°C with a shake speed of 1000 rpm. A 1:1 interaction model was used to fit the data using the FortéBio Data Analysis software 8.2.0.7. Measured data are shown in blue; interaction fit is shown in red. Calculated association and dissociation rates and the KD value are given in the table.
Custom Antibody Development - Useful Reading
- A Powerful Approach to Biotherapeutic Discovery
- Meet the New Wave of Therapeutic Antibodies
- How New Custom Tools Advance Novel Therapeutic Antibodies
- The Antibody Saga – Key Milestones and Big Predictions
- Antibody Discovery – What The Future Holds
Custom Antibody Guidance - Useful Reading
Related Topics
- Antibodies for bioanalytical method development
- Custom recombinant monoclonal antibody generation using HuCAL technology
- Characterization of critical reagents for ligand binding assays
- Technical articles featuring applications of anti-biotherapeutic antibodies
- Poster download: Characterization of anti-idiotypic antibodies for bioanalytical assays
Why Choose Bio-Rad
Anti-Idiotypic Antibodies
Discover the ten key reasons our anti-IDs are market leaders
With over 350 products, Bio-Rad offers one of the largest ranges of anti-IDs available on the market.
This downloadable infographic allows you to explore the top reasons to choose from our expansive range of ready-made antibodies, including stringent quality control, specificity testing, and performance guarantee.
