Controls for Flow Cytometry
Controls are vital to any flow cytometry experiment to reliably distinguish your results from background variation and nonspecific effects. Here you will learn about the essential controls you should include in your experiment and when to use them to obtain publication quality data.
Unstained Controls
Before starting an experiment, familiarize yourself with the instrument you will use so you know which lasers and filters are available. This will help you choose compatible fluorophores which can be easily detected and pick the optimal filter set. Use unstained cells to set up the instrument so that all of your cells can be easily visualized on forward scatter (FSC) and side scatter (SSC) plots. Then set photomultiplier tube (PMT) voltages so that negative cells and dim signals can be distinguished from electronic noise while keeping bright cells within the scale. This will allow you to determine the level of background fluorescence or autofluorescence in your sample (Figure 1) and set your voltages appropriately for each fluorescence channel, ensuring all signals can be detected. You will be able to save these settings ready to be uploaded in preparation for future experiments. Minor changes may still be required, but you will minimize the amount of precious sample and time required to set up the experiment.
An alternative method for setting PMT voltages uses beads dyed with eight different fluorescence intensities. For this method, select the voltage that gives the maximum difference between the first and second fluorescence peaks to ensure optimum PMT sensitivity. Then make minor adjustments if necessary to avoid very bright cells from being off the scale. However, unstained cells should still be acquired to determine the level of autofluoresence, which may be different in a heterogeneous population such as peripheral blood for the different cell types (Figure 1).
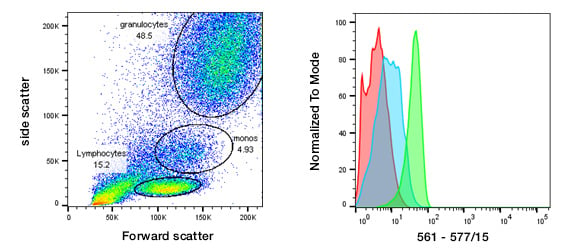
Fig. 1. Unstained peripheral blood.Unstained peripheral blood was used as a negative control to set the FSC, SSC, and PMT voltage (561 nm laser, 577/15 filter shown). The autofluorescence of different populations can be clearly observed in the histograms. Red, lymphocytes; blue, monocytes; green, granulocytes.
Fc Block Controls
Fc receptors are found on monocytes, macrophages, dendritic cells, and B cells. They bind antibodies via the constant Fc domain, rather than the antigen-specific Fab domain, leading to multiple antibodies binding to unintended targets.
This type of binding can lead to false positives, reduced resolution between the positive and negative cells, and poor data (Figure 2). In order to prevent it, Fc blocking reagents such as Human Fc Seroblock and Mouse Seroblock FcR, can be added to your staining protocol to ensure only antigen-specific binding is observed. Alternatively, diluted serum from the sample type will bind to Fc Receptors (for example mouse serum can be used for mouse cells).
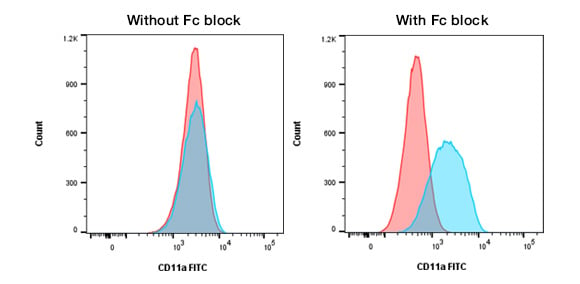
Fig. 2. Staining of THP-1 cells with CD11a in the presence or absence of Fc block. Staining of THP-1 cells with FITC labeled Mouse Anti-Human CD11a, MCA1848F (blue histograms), or FITC labeled Mouse IgG2a Negative Control, MCA929F (red histograms), in the absence and presence of Human SeroBlock (BUF070A).
Isotype Controls
Isotype controls were developed for surface staining. Their role is to ensure specificity of antibody binding and that the observed staining is due to specific binding rather than an artifact. They are raised against an antigen, such as keyhole limpet hemocyanin or dinitrophenol, that is not found on the cell type or sample being analyzed. They should be selected to match the host species, the Ig subclass, and the fluorophore of the primary antibody, and used at the same concentration as the primary antibody. Also, as the fluorophore conjugation to an antibody can vary between suppliers, we recommend purchasing the isotype control and primary antibody from the same supplier.
It should be noted that isotype controls may not be suitable for intracellular staining and should not be used to set gates. Although the validity of their use can divide researchers, they can reveal issues such as insufficient Fc blocking. To find out more about how isotype controls can be used in your flow cytometry experiments, when to use them, and which ones to use, visit our dedicated isotype controls webpage.
Viability Controls
The quality of your sample will determine the quality of your data. Dead cells have a high level of autofluorescence and nonspecific antibody binding, which can lead to false positives and a reduction in the detectable dynamic range. This will make it difficult to detect weakly positive samples and rare populations. Using a forward and side scatter gate will allow you to exclude debris and some dead cells, but it will not remove them all. Therefore, a viability dye should be included in your flow cytometry panel. Figure 3 illustrates an example in murine bone marrow where combining a viability dye with a forward and side scatter gate significantly improves the data quality. By using a forward and side scatter gate to exclude dead cells, you can identify GR-1 and CD11b dual positive myeloid cells (upper right quadrant) in murine bone marrow (Figure 3a). When a viability dye is introduced, in this case propidium iodide, you can see that the same forward and side scatter contains both live and dead cells (Figure 3b). When the viability dye and forward and side scatter gate are combined, the staining for CD11b and GR1 is clearer and some staining, presumably from dead cells highlighted by the purple box, has disappeared (Figure 3c). Furthermore, distinct populations within the GR-1 and CD11b can now be seen.
There are two types of viability dyes. DNA binding dyes, such as propidium iodide, 7-AAD, and DAPI, will fluoresce upon binding to nucleic acid, but cannot pass through an intact cell membrane. Therefore only dead cells, with a permeable membrane, will fluoresce. The different excitation and emission wavelengths of these dyes allow inclusion into many multicolor panels but the samples cannot be fixed.
The second type of viability dye, protein binding dyes, covalently binds to free primary amines on proteins, which are present on the surface of cells. When the membrane is compromised, the dyes permeate the cells and react with intracellular primary amines. Greater fluorescence is observed in dead cells due to their increased content of accessible free amines, allowing them to be easily distinguished from live cells. VivaFix Cell Viability Assays are fixable viability dyes, available in a wider range of excitation and emission spectra than nucleic acid binding dyes, for convenient analysis and addition to multicolor flow cytometry panels.
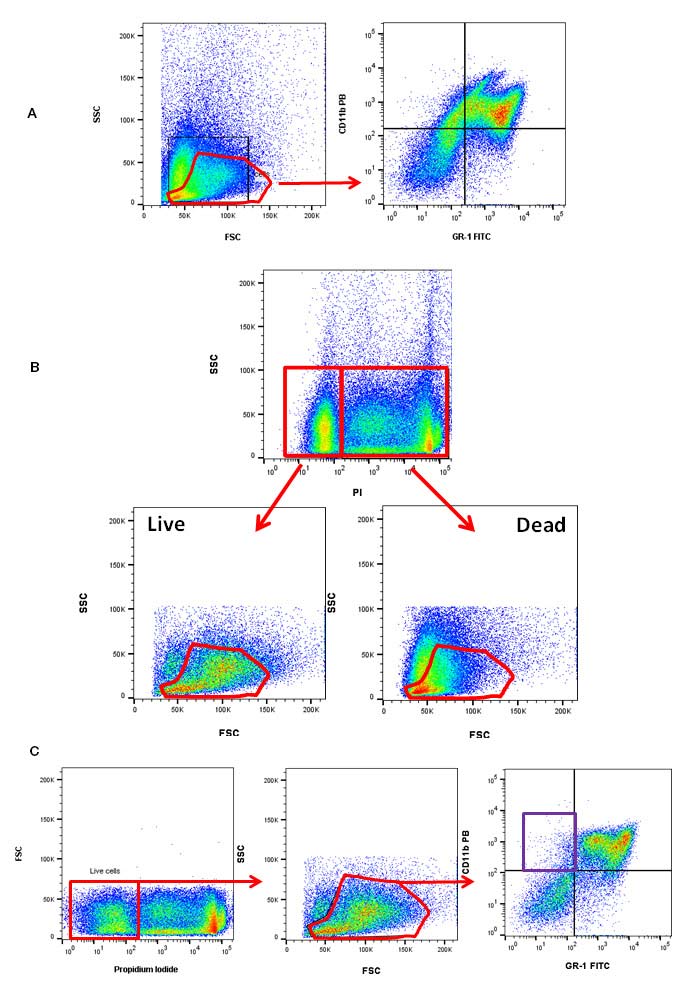
Fig. 3. Using a viability dye to exclude dead cells. A, a forward and side scatter gate was used to select Gr-1 and CD11b positive cells in murine bone marrow (upper right quadrant). B, the viability dye propidium iodide (1351101) shows forward and side scatter gates are not the most effective gates for eliminating dead cells from analysis. C, using a combination of the viability dye propidium iodide and a forward and side scatter gate, CD11b (MCA711PB) and GR-1 (MCA2387F) positive cells can be identified in murine bone marrow.
Viability dyes are also used to determine the proportion of dead cells from apoptotic cells in apoptosis assays such as annexin V or FLICA Kit.
Single Staining and Compensation Controls
Compensation controls are single-stained samples for each antibody in your panel and are essential for any multicolor experiment. They reveal the level of spillover of the fluorophore into the other detectors. The spillover can then be mathematically removed, ensuring only specific signals are used in the final analysis. This is known as compensation. This can be seen in figure 4, in which FITC from CD45RA staining is removed from the PE channel after compensation.
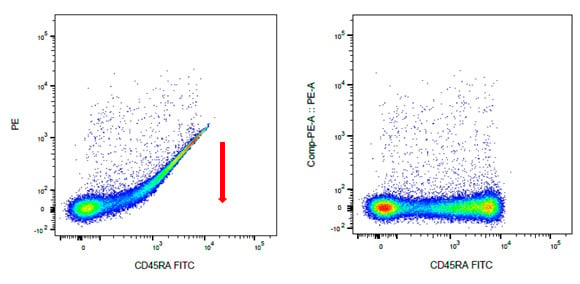
Fig. 4. Compensation controls correct for fluorescence spillover. Human lymphocytes were stained with CD45RA (MCA88). A, staining without compensation. B, staining after compensation has been applied.
This spillover from each fluorophore should be compensated in every channel in which a fluorophore is used. To be effective, the compensation control should ideally be as bright as the sample.There needs to be a positive and a negative population in the sample. If 100% of cells have positive staining, for example CD45 on peripheral blood, then unstained cells can be spiked into the sample to give a negative population. You must use the same fluorophore for the sample and control, and sufficient events must be collected. A good guide is 5,000 for both positive and negative populations, for the software to make a statistically significant determination of spillover.
Once the compensation has been set, do not change the PMT voltages, as this will negate the compensation settings. Historically, compensation was performed manually by increasing or decreasing the compensation until the mean fluorescence intensity (MFI) of the negative and positive populations in neighboring detectors was equal. Luckily, modern software has enabled this process to be automated, thus improving accuracy. You have access to more detailed information on fluorophores, and a Spectraviewer to help you choose the most appropriate fluorophore for your experiments.
Fluorescence Minus One (FMO) Controls
When acquiring and analyzing data, in addition to spillover, fluorescence spread can occur, which is particularly noticeable after compensation and from brighter fluorophores. Carefully selecting the right fluorophores, and avoiding channels with large amounts of spreading, will help reduce it. In addition, an FMO control will help determine positive from negative populations, and therefore where to set your gates (Figure 5). Each FMO control, as the name suggests, is the addition of all fluorescently labeled antibodies in the panel minus one to see the influence of each fluorophore on the panel and its spread into neighboring channels (Figure 5). Ideally an FMO control should be performed for all the fluorophores in the panel, especially when starting a new multicolor panel.
An example of an FMO matrix is shown below in table 1. Figure 5 shows how the fluorescence spread from other channels can affect the data, and therefore why it is important to ensure that you position your gates accordingly, considering the fluorescence spread.
Tube |
FITC |
PE |
PE-A750 |
PE-Cy5 |
|---|---|---|---|---|
|
Unstained |
- |
- |
- |
- |
|
FITC – FMO |
- |
+ |
+ |
+ |
|
PE - FMO |
+ |
- |
+ |
+ |
|
PE-A750 - FMO |
+ |
+ |
- |
+ |
|
PE-Cy5 - FMO |
+ |
+ |
+ |
- |

Fig. 5. Use of FMO controls to determine fluorescence spread and to set accurate gates. Dot plots showing the spread of fluorescence into the PE-Cy5 channel in the FMO-PE-Cy5 control compared to the unstained control allowing correct gating (black dotted line) for the fully stained sample.
Intracellular Staining Controls
Intracellular staining can be more problematic than surface staining, often due to higher levels of background within cells caused by protein-protein interactions. Isotype controls have been optimized for cell surface staining, to control for nonspecific binding of antibody and fluorophore, so they may not always be suitable as an intracellular staining control. Other controls such as a negative cell line, an antibody known to be negative on your cells, or a secondary antibody alone (if using primary and secondary antibodies) can be useful to determine specific binding. An example of using a secondary antibody alone can be seen in Figure 6.
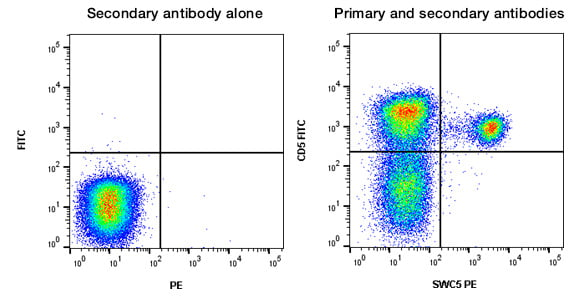
Fig. 6. Secondary antibody alone control staining of porcine lymphocytes. Porcine cells were stained with Goat Anti-Mouse IgG1:RPE (STAR132PE) as a secondary antibody alone control or FITC conjugated Mouse Anti-Pig CD5 (MCA2307F) and Mouse Anti-Pig SWC5 (MCA6050GA) detected with Goat Anti-Mouse IgG1:RPE (STAR132PE). All experiments performed on red cell lysed porcine blood gated on lymphocytes in the presence of 10% pig serum. Data acquired on the ZE5 Cell Analyzer.
An example of a good control for intracellular staining is staining for a T cell specific marker in peripheral blood and checking the B cells and monocytes are negative within the same sample. Additionally, because intracellular staining requires fixation and permeabilization, staining without permeabilizing the cells will give you some information on the levels of background surface staining. As well as controlling for the antibodies, appropriate controls for the other reagents must also be included. The fixative and permeabilization buffers used for intracellular staining may affect your cell’s morphology, so you may have to alter the position of the gates normally used in analysis. The fixation and permeabilization conditions may need optimizing and some reagents may not be suitable. To find out more about optimizing your intracellular staining go to our intracellular staining tips page.
Biological Controls
In addition to staining and isotype controls, you should also consider biological controls that will enable you to determine staining specificity and experimental limitations. Biological controls are important for all staining, but especially for intracellular staining, which can have higher background fluorescence than cell surface staining. Controls include known negative and positive samples. Examples of these are: cells known from the literature to either express or lack expression of the antigen of interest, cells where the antigen has been knocked down or out using RNAi or CRISPR technology, or cells which have been transfected and the antigen is being over expressed to ensure positive staining. An example is shown in Figure 7 where human peripheral blood has been stained for CD66b; cells within the lymphocyte gate are negative, whereas the granulocytes are positive as expected.
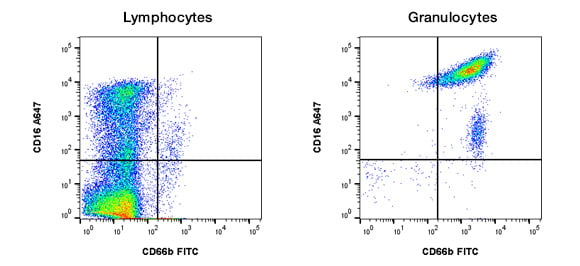
Fig. 7. Use of a biological control. Human peripheral blood was stained for the granulocyte specific marker CD66b (MCA216F) and counterstained for CD16 (MCA1193). Lymphocytes were negative for CD66b whereas granulocytes were positive showing specific antibody staining.
For other experiments, such as cytokine release measurement or cellular activation, an unstimulated and fully stimulated control is important.This will determine both positive and negative results and the dynamic range of fluorescence staining in your experiment, as well as ensure the antibody is performing as expected. An example of this can be seen in Figure 8, in which human peripheral blood lymphocytes were stained for CD154 on stimulated and unstimulated cells. This type of control may also help you choose the most appropriate fluorophore, as small changes may have better resolution with brighter fluorophores. Understanding your experiment and your sample is important when choosing the right biological control.
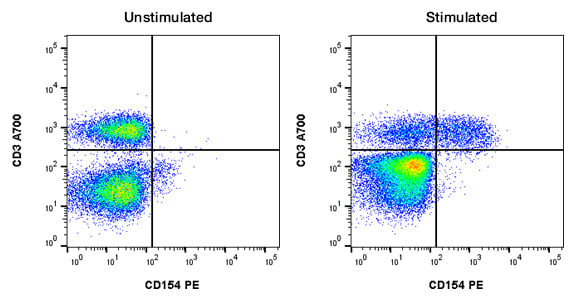
Fig. 8. Use of stimulated and unstimulated controls. Human peripheral blood was unstimulated or stimulated with PMA and ionomycin for 5 hr and then stained for CD3 (MCA463A700) and CD154 (MCA1938PE).
Summary
Controls are just one of several important experimental considerations in flow cytometry. Other examples include careful sample preparation, doublet discrimination, optimizing staining protocols, and appropriate fluorophore handling. More information on these topics can be found in our Optimize Your Flow webinar and in our popular Flow Cytometry Guide. When building multicolor panels, you should also pay attention to fluorophore choice, antigen density, and antibody titration when designing your experiments. More help and information can be found in the resources at the end of this article.


