Antibodies Conjugated to Fluorophores
Bio-Rad offers a wide range of antibodies conjugated to all of the most commonly used fluorescent dyes and to our new proprietary StarBright Dyes, bright dyes specifically designed for flow cytometry.
We also offer Alexa Fluor and DyLight conjugates in an array of colors, both with outstanding spectral properties, suitable for use in flow cytometry, fluorescence microscopy, and fluorescent western blotting.
If the labeled version you need is not available, you can use our easy-to-use LYNX Rapid Conjugation Kits for many popular dyes and tandem conjugates, and Readilink Antibody Conjugation Kits for flow cytometry optimized fluorophores.
Fluorophores for Flow Cytometry
Not all fluorophores are suitable for every antibody based application. For example, even though PE is bright, it is easily bleached and therefore is not suitable for fluorescence imaging.
Due to the increase in the size of flow cytometry panels, conventional flow cytometry requires bright fluorophores that have a specific excitation and emission wavelength from one laser. Spectral flow cytometry however requires unique spectral profiles to allow unmixing in panels. These fluorophores must be compatible with each other in the panel and ideally should be photostable and show no loss of fluorescence when fixed.
Visit our Flow Cytometry Fluorophores Page for more detailed information on flow cytometry compatible fluorophores, including our new proprietary StarBright Dyes.
Single Dyes
| Fluorophore | Fluorescence Color | Maximum Absorbance (nm) |
Maximum Emission (nm) |
Relative
Brightness
|
Spectrally Similar Dyes |
|---|---|---|---|---|---|
| StarBright UltraViolet 400 | 347 | 394 | 3 | BD Horizon Brilliant Ultraviolet 395 | |
| DyLight 405 | 400 | 420 | 3 | Alexa Fluor 405, Cascade Blue | |
| StarBright Violet 440 | 383 | 436 | 5 | Pacific Blue, Super Bright 436, eFluor 450 | |
| StarBright UltraViolet 445 | 335 | 440 | 3 | DyLight350 | |
| Pacific Blue | 401 | 452 | 1 | ||
| StarBright Violet 475 | 405 | 479 | 4 | BD Horizon Brilliant Violet 480 | |
| StarBright UltraViolet 510 | 340 | 513 | 3 | BD Horizon Brilliant Ultraviolet 496 | |
| StarBright Violet 515 | 405 | 516 | 5 | BD Horizon Brilliant Violet 510 | |
| DyLight 488 | 493 | 518 | 4 | Alexa Fluor 488, FITC | |
| Alexa Fluor 488 | 495 | 519 | 3 | DyLight 488, FITC | |
| FITC | 490 | 525 | 3 | Alexa Fluor 488, DyLight 488, BD Horizon Brilliant Blue 515 | |
| Amethyst Orange | 405 | 540 | 1 | Pacific Orange | |
| StarBright UltraViolet 575 | 340 | 569 | 4 | BD Horizon Brilliant Ultraviolet 563 | |
| StarBright Violet 570 | 402 | 571 | 4 | BD Horizon Brilliant Violet 570 | |
| DyLight 550 | 562 | 576 | 4 | PE, SBY575 | |
| PE | 496/546 | 578 | 5 | DyLight 550, SBY575 | |
| StarBright Yellow 575 | 548 | 579 | 3 | PE, DyLight550 | |
| hFab Rhodamine* | 530 | 580 | 3 | ||
| StarBright Blue 580 | 475 | 582 | 4 | AF532, PE | |
| StarBright Yellow 605 | 572 | 606 | 3 | PE-Dazzle594, PE-DyL594 | |
| StarBright Violet 610 | 402 | 607 | 4 | BD Horizon Brilliant Violet 605, Super Bright 600 | |
| StarBright UltraViolet 605 | 340 | 609 | 4 | BD Horizon Brilliant Ultraviolet 615 | |
| StarBright Blue 615 | 475 | 612 | 4 | PE-Dazzle594, PE-CF594 | |
| Texas Red | 596 | 615 | 2 | ||
| APC | 650 | 661 | 4 | Alexa Fluor 647, Cy5, SBR670, DyL650 | |
| Alexa Fluor 647 | 650 | 665 | 4 | APC, Cy5, DyL 650, SBR670 | |
| StarBright Red 670 | 650 | 666 | 4 | APC, A647, DyL 650, Cy5 | |
| StarBright Violet 670 | 401 | 667 | 5 | BD Horizon Brilliant Violet 650, Super Bright 645 | |
| StarBright Yellow 665 | 554 | 670 | 3 | PE-Cy5, PE-A647 | |
| Cy5 | 649 | 670 | 3 | APC, A647, DyL 650, SBR670 | |
| DyLight 650 | 654 | 673 | 4 | Alexa Fluor 647, Cy5 | |
| StarBright Blue 675 | 476 | 675 | 5 | PE-Cy5, PE-A647 | |
| PerCP | 490 | 675 | 2 | ||
| StarBright UltraViolet 665 | 340 | 669 | 4 | BD Horizon Brilliant Ultraviolet 661 | |
| StarBright Blue 700 | 470 | 705 | 5 | PerCP-Cy5.5, BD Horizon Brilliant Blue 700 | |
| StarBright Red 715 | Infrared | 638 | 712 | 4 | A700 |
| DyLight 680 | Infrared | 692 | 712 | 3 | Alexa Fluor 680, Cy5.5 |
| StarBright Violet 710 | Infrared | 402 | 713 | 5 | BD Horizon Brilliant Violet 711, Super Bright 702 |
| StarBright Yellow 720 | Infrared | 549 | 719 | 4 | PE-Cy5.5, PE-Fire700 |
| Alexa Fluor 700 | Infrared | 702 | 723 | 2 | SBR715 |
| StarBright UltraViolet 740 | Infrared | 343 | 743 | 4 | BD Horizon Brilliant Ultraviolet 737 |
| StarBright Violet 760 | Infrared | 403 | 754 | 4 | BD Horizon Brilliant Violet 750 |
| StarBright Blue 765 | Infrared | 476 | 764 | 4 | PE-A750, PE-Cy7 |
| StarBright Red 775 | Infrared | 653 | 778 | 3 | APC-Cy7, APC-eFluor 780 |
| DyLight 755 | Infrared | 752 | 778 | 4 | Alexa Fluor750 |
| StarBright Violet 790 | Infrared | 402 | 782 | 4 | BD Horizon Brilliant Violet 785, SB780 |
| StarBright Yellow 800 | Infrared | 549 | 788 | 4 | PE-Cy7, PE-A750 |
| StarBright UltraViolet 795 | Infrared | 340 | 792 | 2 | BD Horizon Brilliant Ultraviolet 805 |
| DyLight 800* | Infrared | 777 | 794 | 4 | IR Dye 800 |
| StarBright Blue 810 | Infrared | 477 | 802 | 4 | |
| StarBright Red 815 | Infrared | 654 | 811 | 3 | APC-Fire 810 |
* Western blot tested
Abbreviations: APC; allophycocyanin, FITC; fluorescein isothiocyanate, PE; phycoerythrin (Note. phycoerythrin (PE) is the same as R-phycoerythrin (RPE)), PerCP; peridinin-chlorophyll-protein complex.
Tandem Dyes for Flow Cytometry
When designing panels of eight or more colors, tandem dyes, such as APC-Cy7, have to be included. This is due to both laser excitation and single fluorophore limitations, which make it necessary for a single laser to excite the maximum number of fluorophores possible.
Tandem dyes, as the name implies, consist of two different covalently attached fluorophores (a donor and an acceptor molecule). With regards to spectral properties, the tandem dye has the excitation characteristics of the donor fluorophores and the emission characteristics of the acceptor molecule. These properties are due to Förster resonance energy transfer (FRET; also known as fluorescence resonance energy transfer); a process in which energy is passed on from an excited donor to a nearby acceptor molecule, which then emits a photon of light.
For tandem dyes the following guidelines should be followed:
- Tandem dyes are highly susceptible to photobleaching and therefore need to be protected from light at all times
- Tandem dye antibody conjugates should never be frozen. Freezing might result in denaturing of the donor fluorophores and thereby no or reduced staining
- The brightness of tandem dyes might be reduced by a fixation or permeabilization step. If fixation or permeabilization is required, the duration should be as short as possible
- Tandem dyes have a high batch-to-batch variation and therefore each batch has to be re-optimized. Tandem dyes are highly variable between different suppliers
| Fluorophore | Fluorescence Color | Maximum Excitation (nm) | Maximum Emission (nm) |
Relative
Brightness
|
Spectrally Similar Dyes |
|---|---|---|---|---|---|
| PE-Alexa Fluor 647 | 496, 546 | 667 | 4 | SBY665 | |
| PE-Cy5 | 496, 546 | 667 | 5 | SBY665 | |
| PE-Cy5.5 | 496, 546 | 695 | 4 | SBY720 | |
| PE-Alexa Fluor 700 | Infrared | 496, 546 | 723 | 2 | PE-Cy5.5, SBY720 |
| PE-Alexa Fluor 750 | Infrared | 496, 546 | 779 | 4 | PE-Cy7, SBY800 |
| PE-Cy7 | Infrared | 496, 546 | 785 | 4 | PE-Alexa Fluor 750, SBY800 |
| APC-Cy7 | Infrared | 650 | 785 | 2 | SBR775 |
Abbreviations: APC; allophycocyanin, FITC; fluorescein isothiocyanate, PE; phycoerythrin (Note. phycoerythrin (PE) is the same as R-phycoerythrin (RPE)), PerCP; peridinin-chlorophyll-protein complex.
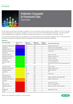
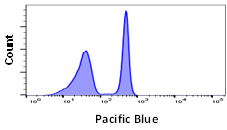
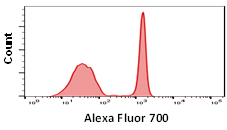
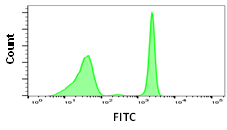
Relative Brightness
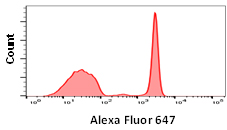
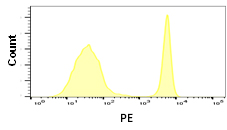
Although some fluorophores may have similar excitation and emission wavelengths, their relative brightness may be different. Fluorophore brightness depends on how many photons a fluorophore emits when being excited by a laser, as well as the conversion rate of those photons when they hit the detectors and are converted into electrons. The relative brightness can be an important factor in flow cytometry to obtain good signal resolution. If an antigen is highly abundant, most fluorophores can be used, however low abundance antigens and rare cell populations will require bright fluorophores to achieve sufficient separation from the negative population. When building larger panels, good separation will improve the analysis of your data and may allow you some leeway in your fluorophore choices. The graphs below show how fluorophore brightness can affect the appearance of flow cytometry data.
| Laser line | Maximum excitation (nm) | Maximum emission (nm) | Filter | Relative brightness | |
|---|---|---|---|---|---|
|
405 | 410 | 455 | 460/22 | 1 |
|
640 | 702 | 723 | 720/60 | 2 |
|
488 | 490 | 525 | 525/35 | 3 |
|
640 | 650 | 665 | 670/30 | 4 |
|
561 | 546 | 578 | 577/15 | 5 |
Fig. 1. Fluorophore relative brightness. Examples of staining showing the relative brightness of common fluorophores on the same cell population. Data collected on the ZE5 Cell Analyzer.
Many factors will affect the appearance of data. This can be the flow cytometer, filters and laser used to excite the fluorophore, the laser power and instrument settings as well as the type of plot chosen. Other examples include the sample used, antibody clone, the F:P ratio and staining protocol. Finally, remember that each fluorophore will influence another in a multicolor panel so compensation and fluorescence spread should be considered when choosing a fluorophore.
For more information about fluorophores and immunophenotyping, refer to our flow cytometry resources.
Click on the links below to find more in-depth information on each topic and view our popular flow cytometry basics guide
Resources for Flow Cytometry
- Sample preparation
- Controls
- Multicolor panel building
- Common flow cytometry protocols
- Cell frequency in common samples
- Gating in flow cytometry
- Fluorophores poster (downloadable)
- Flow cytometry basics guide (downloadable)
- Fluorescent spectraviewer
- Flow cytometry poster (downloadable)
Popular Resources

Blog: Sample Preparation in Flow Cytometry — Tips & Tricks
In this blog, we provide tips and advice on generating a high-quality sample for flow cytometry.
Quick Guide: How to Implement an Effective Flow Cytometry Gating Strategy
Download this quick guide to learn how to develop effective flow cytometry gating strategies, avoid common pitfalls such as false positives and missed rare populations, and generate reliable, reproducible data through a systematic approach to panel design and analysis.