Gating Strategies for Effective Flow Cytometry Data Analysis
Data Analysis in Flow Cytometry
Flow cytometry analysis is built upon the principle of gating. Gates and regions are placed around populations of cells with common characteristics, usually forward scatter (FSC), side scatter (SSC), and marker expression, to investigate and to quantify these populations of interest. Here we will show what the common flow cytometry graph outputs look like and how in a few simple steps you can identify different cell populations that have been stained with antibodies conjugated to fluorophores.
Before you start your flow cytometry experiment, if possible, it is a good idea to find out as much as possible about the cells and include the right controls. This can be simple things like having an estimation of the size of the cells and if they are likely to change during your experiment. This can be especially useful if you are performing intracellular staining as the fixation and permeabilization process can alter cell size and granularity, resulting in altered forward and side scatter profiles. If your cells have a known marker it can be useful to include this in your staining as it will help identify your cells of interest. Conversely a known negative can also help by allowing you to set negative gates and determine real populations. To find out more about controls go to our dedicated controls in flow cytometry page.
Forward and Side Scatter
The first step in gating is often distinguishing populations of cells based on their forward and side scatter properties. Forward and side scatter give an estimation of the size and granularity of the cells respectively, although this can depend on several factors such as the sample, the wavelength of the laser, the collection angle and the refractive index of the sample, and the sheath fluid. Distinguishing populations of cells can be relatively straight forward for cell lines where there is only one type of cell, but it can be more complex for samples where there are multiple cell types. As can be seen in the density plot in figure 1a, red cell lysed whole blood has several distinct populations. The red/yellow/green/blue hot spots indicate increasing numbers of events resulting from discrete populations of cells. The light scatter patterns of granulocytes, monocytes, and lymphocytes allow them to be distinguished from cellular debris and dead cells. Lymphocytes have been circled in figure 1b. Debris and dead cells often have a lower level of forward scatter and are found at the bottom left corner of the density plot. The forward scatter threshold can be increased to avoid collecting these events, or they can be removed by gating on the populations of interest, shown by the red box in figure 1c. This method is often used to remove dead cells which have increased autofluorescence and non-specific binding of antibodies. However using a viability dye is a much more effective and reliable method. Find out more about viability dyes in flow cytometry.
The events can also be displayed as a dot plot where no density information is shown or as a contour map to show the relative intensity of scatter patterns. It is down to the user preference as to which display is preferred.

Fig. 1. Red cell lysed whole blood. (a) SSC vs FCS density plot. Each dot or point on the plot represents an individual particle that has passed through the laser. (b) A gate has been applied to identify a specific population, in this case lymphocytes or to remove debris (c).
Single Parameter Histograms
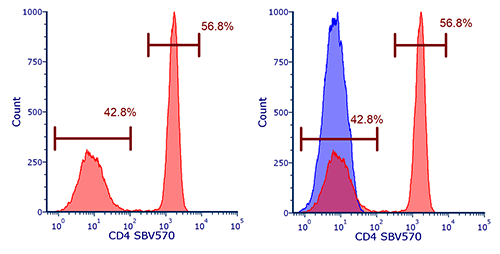
As we have mentioned gates can be applied to density plots to exclude populations (e.g. debris) or to positively select populations for further examination as has been done in figure 1b with a lymphocyte gate. The events or cells within the gate can be further analyzed for expression of markers. In this case blood was stained for CD4 and the data expressed in a histogram after first selecting the lymphocytes. As can be seen, there are two peaks which can be interpreted as the positive and negative dataset with the CD4 positive T cells representing around 56% of the cells within the lymphocyte gate. In order to accurately identify the positive dataset, flow cytometry should be repeated in the presence of appropriate controls such as isotype, FMO, and unstained controls. This is particularly necessary if a single distinct peak is observed, however often in flow cytometry multiple peaks are observed due to mixed populations. Figure 2 shows a control histogram (in this case an unstained control), in blue, overlaid onto the stained positive dataset, in red, allowing the positive cells to be accurately identified.

Fig. 2. Single parameter histograms. (a) Cells within the lymphocyte gate defined in figure 1(b) are represented in a histogram to evaluate the relative expression of a marker, in this case CD4 SBV570 (MCA1267SBV570). (b) Overlay of a negative population onto the stained population allows easy identification of the positive cells.
Using analytical software, measurements, and statistics can be obtained for many parameters in addition to the number of cells and percentage of cells within the gate. This can include measurements such as median and mean fluorescence intensity (MFI) often used when there are small increases or decreases in fluorescence.
Two-parameter Density Plots
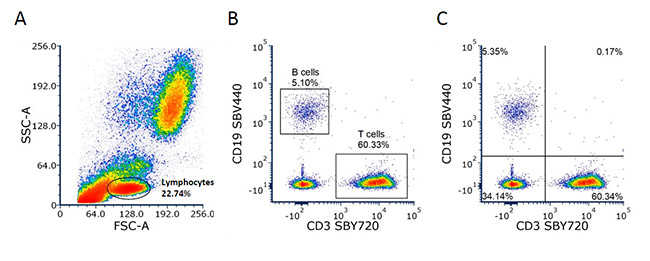
These graphs display two measurement parameters, one on the x-axis and one on the y-axis, and the events as a density (or dot) plot. The parameters can be fluorescence, FCS, or SSC depending on what you want to show. In Figure 3 below, the lymphocytes determined by forward and side scatter (a) are stained with CD3 and CD19 to identify the T and B cell populations. The relative proportion of B and T cells can then be quantified by placing gates around the distinct populations. In this case, there are 5% B cells and 60% T cells (b). This data can also be visualized where the density plot is split into four quadrants allowing you to determine the cells single positive for each marker and both double negative and double positive (c). When the expression levels do not show distinct populations or are not mutually exclusive the appropriate controls will help you determine the positive and negative populations.

Fig. 3. Two-parameter (dual color fluorescence) density plot. Red cell lysed whole blood was stained with CD3 (MCA463SBY720) and CD19 (MCA1940SBV440). The lymphocytes were determined by the forward and side scatter profile (a) and the B and T cell percentages were determined using different gating methods (b) and (c).
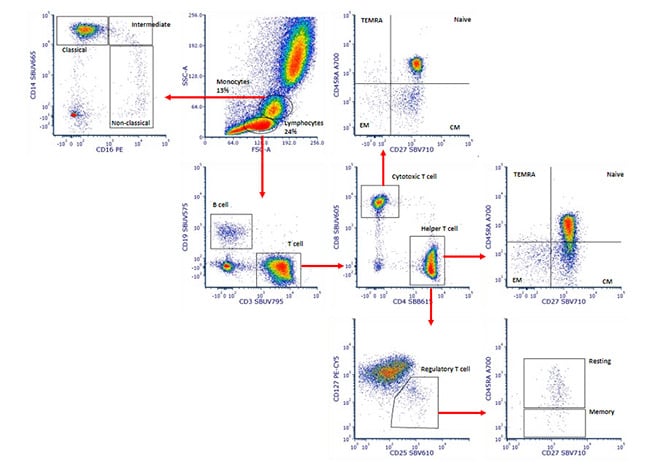
This simple principle of gating can be applied again and again to further determine the expression patterns on particular cell types. This is particularly useful as the number of markers and fluorophores in a single experiment increases. An example of a multicolor experiment where simple sequential gating has been used to identify specific cell populations is shown below in figure 4. Briefly, the monocytes and lymphocytes were identified and gated by their forward and side scatter. The monocytes could be identified as classical, intermediate, and non-classical by their CD14 and CD16 expression levels. The lymphocytes could be split into B cells and T cells by the CD19 and CD3 expression. CD3 positive T cells were then further identified and gated by the expression of CD4 and CD8 to identify helper and cytotoxic cells. The relative expression of CD27 and CD45RA within the CD4 and CD8 populations could identify CD45RA+CD27+ naïve cells, CD45RA-CD27+ central memory (CM) cells, CD45RA+CD27- terminal effector memory RA+ (TEMRA) cells, and CD45RA- CD27- effector memory (EM) cells. Within the CD4 population, CD127 and CD25 expression revealed regulatory T cells and the relative expression of CD45RA and CD27 within this gate allowed identification of resting and memory cells. This principle can be continued with additional markers, but it is worth noting that as the cell populations become more defined, there are fewer events within each gate, as seen in the regulatory T cell gate, showing the importance of collecting the right number of cells.

Fig. 4. Sequential gating to identify specific peripheral blood subsets. Red cell lysed whole blood was stained with CD14 (MCA1568SBUV665), CD16 (MCA2537PE), CD19 (MCA1940SBUV575), CD3 (MCA463SBUV795), CD4 (MCA1267SBB615), CD8 (MCA1226SBUV605), CD27 (MCA755SBV710), CD45RA (MCA88A700), CD25 (MCA2127SBV610) and CD127. The gating strategy is shown by the red arrows
Backgating to Confirm Gating Strategies
Backgating is a useful method of identification of cells to confirm a staining pattern or gating method. It allows you to analyze cells identified in a gate on dot plots with different parameters. This can be useful if you are unsure of your gates, the expression levels, non-specific binding, or the presence of dead cells and need additional information to identify your cells. This can be seen in figure 5. Red cell lysed whole blood (a) was stained for CD3 and CD14 (b) and gates placed around the 3 populations A, B, and C. It can be assumed that population B are granulocytes but no specific marker has been used so a backgating strategy onto a forward and side scatter plot (c) can be used to try and identify the cells by their forward and side scatter. The forward and side scatter profiles confirm the gating. Cells in A (monocytes) are colored in blue, cells in B (granulocytes) are colored in red, and cells in C (lymphocytes) are colored in green.

Fig. 5. Backgating to identify leukocyte subsets. (a) Red cell lysed whole blood was stained with CD3 (MCA463A647) and CD14 (MCA1568P750) (b). Cells in gates A, B and C were backgated onto FSC vs SSC (c) to identify specific leukocyte populations.
As we have shown, gating does not need to be a daunting process and by following just a few simple steps you can quickly begin to analyze specific cell populations. As you increase the number of stains and fluorophores you will be able to identify more specific cell populations, but be careful to perform the right controls because as you increase the fluorescence you increase the background and non-specific binding, making the data harder to analyze.
All the plots represented here (apart from figure 1) have first had the dead cells excluded using the viability dye, propidium iodide and doublet discrimination performed by plotting FSC-H vs FSC-A. All cells were stained in the presence of an Fc block. Single stains were performed for compensation controls, FMO controls to check for fluorescence spread and isotype controls were used to determine the level of non-specific binding.
For more in-depth information about Flow Cytometry principles, controls, optimization, and protocols take a look at our Introduction to Flow Cytometry Guide.


