Effective Detection of Autophagy
Introduction
Autophagy is a vital cellular process involved in keeping the immune system working properly and has been linked to a number of diseases, including malignancies. Multiple components of the autophagy pathway can be detected, allowing researchers to efficiently study the process. These include:
- Signaling molecules involved in autophagy induction, such as mTOR and AMPK
- LC3-I and LC3-II. LC3-I is a protein found in the cytosol which becomes lipidated to form LC3-II and is inserted into the membrane of autophagosomes
- Other autophagy-related proteins, like ATG5-12 complex and WIPI1
- Lysosome mass
- Lysosomal markers, such as LAMP1 and LAMP2
These markers tell us about specific components of the autophagy pathway. An alternative method is to measure autophagy activity, also known as autophagy flux. This is a measurement of the whole autophagic process from induction, autophagosome formation, fusion with lysosomes, and breakdown of the autophagosome contents. The different techniques and assays that can be used to investigate autophagy, including the pros and cons of each method, are discussed in more details below.
Techniques Used for Autophagy Detection
The best method to detect autophagy will depend on the experimental question and conditions. No individual assay is appropriate for every situation and it is best practice to confirm findings using more than one method. The use of proper controls is also vital, including positive and negative experimental controls. Below is a summary of the most common techniques used to detect autophagy.
Bio-Rad offers a wide range of antibody and application based resources to help you with your experiments.
Electron Microscopy
Electron microscopy (EM) is the only technique able to identify the morphology and cellular position of autophagy structures, as such this is the most comprehensive method that can be used to measure the whole process. Prior to the discovery of specific autophagy markers, it was the only way to detect autophagy (Jung et al. 2019). EM is the most sensitive method for autophagy detection, but it is time consuming to set-up and requires technical expertise for both generation of images and data interpretation. The characteristic double membrane morphology of autophagsosomes can be difficult to distinguish and depends on the quality of the samples and/or fixative used. In good quality samples, autophagosomes can be identified as well as the single membrane autolysosomes. Autophagy can be quantified simply by scoring for the presence, or absence of autophagic structures in a section of a cell, in the total cytoplasm of a cell or by estimating the cell volume occupied by autophagosomes. However, it can be difficult to accurately quantify autophagy levels due to cellular artefacts derived from the methodology and operator bias. Furthermore this technique is low-throughput (Martinet et al. 2014), (Klionsky et al. 2016).
Western Blotting
The most widely used antibodies to detect autophagy by western blotting are those that detect LC3. LC3 lipidation (LC3-I to LC3-II) results in an increase in molecular weight that can be detected by western blot (Figure 1). Although LC3-II has a greater molecular weight than LC3-I, it migrates faster than LC3-I in SDS-PAGE, which is thought to be due to its increased hydrophobicity (Tanida et al. 2008). The amount of LC3-II detected by western blot (Figure 1) increases with autophagosome number and is a good indicator of autophagosome formation. However, results may be misleading as this assay does not take into account LC3-II turnover. Autophagy induction causes LC3-II levels to increase. This would not be detected by this assay though if there was also an increase in the rate of autophagy flux in the cell, resulting in rapid recycling of LC3-II. In this situation, LC3-II levels may stay the same or increase (Gottlieb et al. 2015).
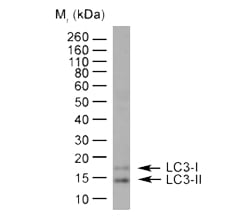
Fig. 1. Detection of LC31/11 by western blotting. HeLa lysate probed with Rabbit Anti-Human LC3A/B (N-terminal) (AHP2167) followed by horseradish peroxidase conjugated Sheep Anti-Rabbit IgG Antibody. As can be seen in the blot, LC3-I and LC3-II can be clearly distinguished from each other.
When prepared in SDS sample buffer (e.g. Laemmli buffer), LC3-II is more sensitive to degradation due to freeze-thawing than LC3-I. Therefore, fresh samples should be prepared and assessed as soon as possible, and repeated freeze-thaw cycles avoided (Klionsky et al. 2016). When quantifying LC3-I / LC3-II by western blotting, as with other proteins, a housekeeper protein is used as a loading control. However, the housekeeper protein actin can be reduced during autophagy induction and should not be used as a loading control for LC3 western blots (Klionsky et al. 2016). Other housekeeping proteins such as GAPDH or tubulin should be considered. An alternative method of quantification is to use Bio-Rad stain-free gels, which allow normalization of your protein of interest against total cellular protein in each lane. Another point to be aware of is that LC3 binds more strongly to PVDF membranes than to nitrocellulose membranes and is lost after stripping and reprobing from both membranes, therefore LC3 should be the first protein probed for on a membrane if you plan to strip and reprobe (Gottleib et al. 2005).
In addition to detecting LC3, other key autophagy-related proteins can be detected by western blotting (Table 1). While they are not definitive markers of autophagy, these proteins can give useful information on the status of autophagy pathways within the cell. These include other proteins expressed on autophagosomes such as WIPI2 and the phosphorylation status of signaling molecules mTOR and ULK1.
Table 1. Anti-human and anti-mouse antibodies available to study the autophagy pathway by western blotting.
Target |
Reactivity |
Catalog Number |
|---|---|---|
|
AMPKα |
Human |
|
|
ATG5-ATG12 complex |
Mouse |
|
|
ATG7 |
Human, mouse |
|
|
Beclin 1 |
Human |
|
|
LAMP1 |
Human |
|
|
LAMP2 |
Mouse |
|
|
MAP1LC3A/B |
Human |
|
|
P62 |
Human |
|
|
WIPI2 |
Human |
Microscopy - Immunofluorescence (IF)
Microscopy can reveal the cellular localization of proteins associated with autophagy. LC3 is a target often studied due to its distinct redistribution during autophagy induction. Cells can be stained using anti-LC3 antibodies or transfected with fluorescently tagged LC3 and analyzed by fluorescence microscopy. Cells with basal levels of autophagy show a diffuse cytosolic LC3 expression pattern. Following autophagy induction, LC3 becomes associated with the membrane of autophagosomes, and LC3 can be seen as a dotted/punctate expression pattern (Figure 2).

Fig. 2. Distribution of basal LC3 and high autophagy conditions. A, during levels of low autophagy, LC3-I is present in the cytoplasm. Following autophagy induction, LC3-I is lipidated to form LC3-II which is bound to autophagosome membranes. B, IF staining of HeLa cells stained with Anti-Human LC3A/B.
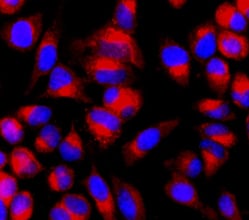
Fig. 3. Capthepsin B staining in HeLa cells. HeLa cells were stained with Magic Red Cathepsin B Kit for 1 hr and counterstained with Hoechst.
Other key autophagy proteins can also be studied by immunofluorescence, such as p62 (also known as SQSTM1). As p62 is involved in a number of cellular pathways, results should be confirmed by other methods. Lysosomes can also be detected by staining for LAMP1 or LAMP2 or by staining for cathepsins using our easy-to-use kits (Figure 3).
Microscopy - Immunohistochemistry (IHC)
Of the techniques covered here to study autophagy, IHC is the least-used technique due to a lack of biomarkers and its susceptibility to misinterpretation. LC3 is the most commonly used marker to evaluate autophagy levels by IHC but requires careful analysis. High levels of cytosolic LC3 make it difficult to clearly see LC3 associated with autophagosomes. It is also common to see false positives due to the nonspecific granular staining pattern of cytoplasmic components (Martinet et al. 2017). Staining of frozen tissues has poorer morphology and resolution, but also the added complication of lipid droplets staining positive for LC3 antibodies when using some fixatives. LC3 is involved in lipid droplet formation and in paraformaldehyde-fixed frozen sections can be seen as small dot like structures around lipid droplets, but not those fixed in acetone (Martinet et al. 2013). Therefore, staining of frozen tissue sample with LC3 is not recommended (Martinet et al. 2013).
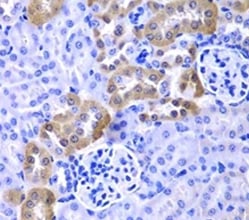
Fig. 4. Detection of LAMP-1 by IHC. Staining of paraffin-embedded human liver cancer using Rabbit Anti-LAMP1 (CD107a) Antibody (AHP2448) at a dilution of 1/100.
When studying autophagy markers in IHC, you should use several markers or additional assays with the right controls, as no one marker can give a complete picture of the state of autophagy in a cell. p62 is used in IHC, but as previously mentioned in the immunofluorescence section, p62 is also involved in other cellular pathways. Other markers you could use include ULK-1, LAMP1, Beclin 1, and ATG5/7 and 12. Figure 4 shows staining for LAMP1. While the staining is clear, differences can also indicate general changes in lysosomal activity rather than increases in autophagy (Klionsky et al. 2016).
A list of IHC and IF validated antibodies suitable for studying autophagy can be found in Table 2.
Table 2. Anti-human and anti-mouse antibodies available to study the autophagy pathway by IF and IHC.
Target |
Reactivity |
Product code |
Application |
|---|---|---|---|
|
ATG7 |
Human, mouse |
IHC |
|
|
LAMP1 |
Human Mouse |
IHC IHC, IF |
|
|
LAMP2 |
Mouse |
IHC |
|
|
MAP1LC3A/B |
Human |
IF |
|
|
P62 |
Human |
IF |
|
|
PI-3 Kinase p85 subunit |
Human, mouse Human |
IHC IHC |
|
|
WIPI2 |
Human |
IF |
Flow Cytometry
Flow cytometry is a powerful technique that allows you to look at autophagy in a highly quantitative manner. In addition to just measuring autophagy, cells can be labeled with several antibodies at the same time allowing multiple cell types to be identified in a mixed cell population. This would only be possible for the western blotting technique by presorting the cells into their respective subpopulations and only a limited number of different cell types could be detected by microscopy. Flow cytometry also allows the detection of several components of the autophagy pathway simultaneously. Another advantage is that large numbers of cells can be analyzed allowing rapid quantification. The drawback for using standard flow cytometry is that it does not provide information on the cellular localization of proteins, however, imaging flow cytometry can be used to overcome this issue (Phadwal et al. 2012).
A common method to study autophagy by flow cytometry involves transfecting cells with a fluorescent LC3 reporter tag (e.g. GFP-LC3). Cytosolic LC3-I can be removed by incubation with saponin, so that only the membrane bound LC3-II remains, which can then be quantified by flow cytometry. Anti-LC3 antibodies can also be used using the same principle of removing cytosolic LC3-I. Saponin interacts and removes membrane cholesterol leaving holes in the cell membrane allowing LC3-I to be removed from the cell. Careful titration of saponin and time of treatment is required to ensure LC3-I is removed without excessive damage to the cell membrane. Including autophagy controls, such as an activator, will indicate if enough saponin is used; an activator will not show an increase in LC3 levels over basal conditions.
Measuring endogenous levels of LC3 has an advantage over transfection using an LC3 reporter tag, as it avoids the need for transfection and potential artefacts that can result from over expression. However, in some cell types or assays, endogenous levels may be below the level of detection, in which case another method will need to be used. Other proteins of the autophagic pathways can be analyzed by flow cytometry including LAMP1/2 and Beclin 1. A more comprehensive list is shown in Table 3.
Table 3. Anti-human and anti-mouse antibodies and kits available to study the autophagy pathway by flow cytometry. Antibodies are available in a purified format (Pur) or conjugated to PE, APC, or FITC.
Target/Kit |
Reactivity |
Catalog Number |
Formats |
|---|---|---|---|
|
Autophagy Assay Kit Red |
Human |
Red (Ex 590 nm, Em 620 nm) |
|
|
LAMP1 |
Human Mouse |
Pur, PE, APC Pur |
|
|
LAMP2 |
Mouse |
Pur |
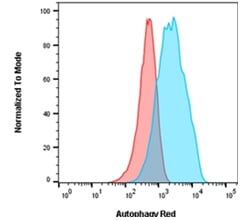
Fig. 5. Autophagy induction in Jurkats measured by flow cytometry using Autophagy Assay Kit Red. Jurkat cells were either untreated for basal conditions (red) or incubated in HBSS for 2 hr and 10 nM bafilomycin A for 2 hr (blue) to induce autophagy. After staining with Autophagy Probe Red for 30 min, cells were washed and analyzed on the ZE5 Cell Analyzer using the 561 nm laser and 640/20 filter.
In addition to measuring specific protein levels, dye-based commercial kits are available to measure autophagy by flow cytometry, such as Bio-Rad’s Autophagy Assay Kit Red (APO010) (Figure 5). This contains a cell-permeant aliphatic molecule that fluoresces brightly when inserted in the lipid membranes of autophagosomes and autolysomes.
Careful consideration needs to be given to the experimental design, including sample preparation, choice of fluorophore, the most appropriate positive control, and how best to determine autophagy flux when detecting autophagy by flow cytometry. This is particularly important in primary cells as changes seen by flow cytometry are often small (Cossarizza et al. 2019). This means positive signals can be hard to detect and false positives need to be minimized.
For more information on how to detect autophagy by flow including experimental setup, multiplexing and appropriate controls, visit our best practices for detecting autophagy by flow cytometry.
Summary
Autophagy can be difficult and time consuming to detect. Take some time to determine which is the most appropriate application and marker for your experiment, and ensure the proper controls are performed. This will depend upon the conditions and results required. Whichever you choose, consider confirming your results in another application or detecting another component of the autophagy pathway, as this will give you more confidence in your results and is often required for peer reviewed publication.
Autophagy is just one of the pathways in regulated cell death. Bio-Rad offers reagents for western blotting, microscopy, and flow cytometry, and resources to help you study these pathways including mini-reviews and a poster available to download.

References
- Cossarizza A et al. (2019). Guidelines for the use of flow cytometry and cell sorting in immunological studies (second edition). Eur. J. Immunol. 49(10), 1457-1973.
- Gottlieb R et al. (2015). Untangling autophagy measurements: all fluxed up. Circulation Research. 116; 504-514.
- Jung M et al. (2019). The autophagy research in electron microscopy. Applied Microscopy 49, 11.
- Klionsky DJ et al. (2016). Guidelines for the use and interpretation of assays for monitoring autophagy (3rd edition). Autophagy 12; 1-222.
- Martinet W et al. (2012). Immunohistochemical analysis of macroautophagy. Autophagy 9, 386-402.
- Martinet W et al. (2014). Methods to assess autophagy in situ--transmission electron microscopy versus immunohistochemistry. Methods Enzymol 543, 89-114.
- Martinet W et al. (2017). Standard immunohistochemical assays to assess autophagy in mammalian tissue. Cells 6 (3), 17.
- Phadwal K et al. (2012). A novel method for autophagy detection in primary cells: impaired levels of macroautophagy in immunosenescent T Cells. Autophagy 8 (4), 677-689.
- Tanida I et al. (2008). LC3 and Autophagy. Methods Mol Bio. 445 77-88.