No Compensation Panels

- On This Page
- Compensation
- Further Reading
Knowing how much compensation to use and when to perform it can be daunting in flow cytometry.
Our four color immunophenotyping panels overcome these challenges. The examples of panels, accessible from the links below, highlight common surface markers for human and mouse blood and tissue that will allow you to identify many populations, such as T cells, B cells, NK and myeloid populations with little or no compensation required.
Compensation
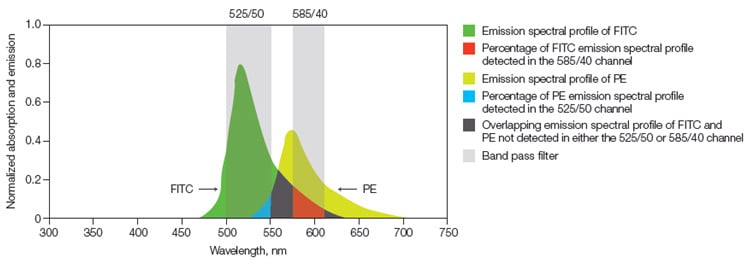
When performing multicolor flow cytometry there is a risk of spectral overlap between fluorophores. FITC, for example, has maximal emission at 525 nm, although it actually emits some photons with higher wavelengths which will pass through other filters and end up being detected by other than the intended PMTs (photomultiplier tubes; detectors). This is known as spectral overlap. So if FITC (with a filter of 525/35) and PE (with a filter of 585/40 in front of its PMT) are combined in a panel, using a 488 nm laser, the relative contribution of FITC and PE fluorophores in both the FITC and the PE detectors must be determined and then removed. This procedure is called compensation (Figure 1) and should be performed for all the fluorophores you are using in a panel.

Fig. 1. Fluorescence compensation. Emission spectra of FITC and PE are shown with a graphical representation of two commonly used filters, 525/50 and 585/40, to detect these fluorophores. Shown in red is the portion of FITC that will be detected in the PE detector and must be subtracted from the PE signal using compensation.
An example of the level of spectral overlap of FITC into the PE and the PE-Cy5 detectors are shown in the flow plots below. The amount of compensation to be applied to PE will be greater than that which needs to be applied to PE-Cy5.

Fig. 2. Relative amounts of fluorescence spillover of FITC into A, PE and B, PE-Cy5. FITC gives a greater signal in the PE channel than the PE-Cy5 channel. Dotted line represents where the negative population would fall below.
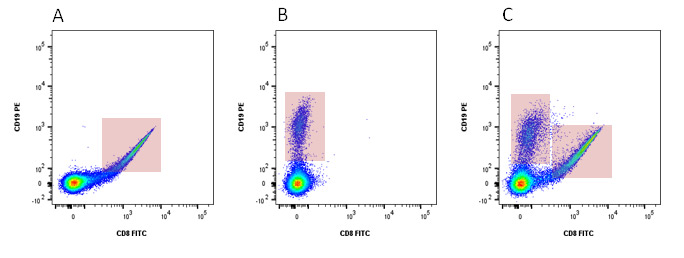
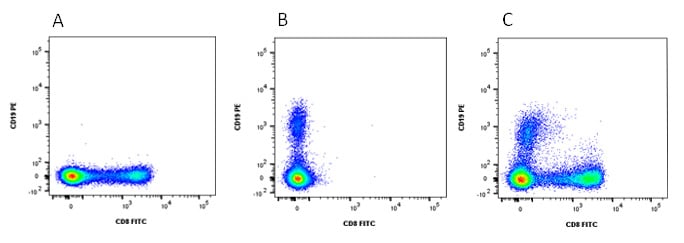
Compensation is a mathematical method developed to account for this spectral overlap and measures the photons deriving from one fluorophore into multiple detectors, so-called false-positive signals. The level of false-positive signals can be determined by single staining your samples with each fluorophore being used. These single stained controls will reveal the level of spectral overlap in each detector. When performing compensation, the fluorophore in the control needs to be identical to the fluorophore used in the sample and its brightness should be at least of a similar level. For more information on controls, go to our dedicated controls in flow cytometry webpage. Figures 3 and 4 show how compensation can be applied to samples to reveal correct levels of staining.

Fig. 3. Analysis without compensation. Peripheral blood was singly stained with CD8 FITC (A) or CD19 PE (B) and both CD8 FITC and CD19 PE (C). In panel A, when compensation was not applied, there is fluorescence spillover into the PE channel from the FITC (marked by the red box). In panel B there is a slight amount of spillover from PE into the FITC channel. Panel C shows how this affects dual staining. Double positive cells are detected even though in this case the markers are mutually exclusive.
Stained cells analyzed with compensation

Fig. 4. Analysis with compensation. When compensation is applied to both FITC and PE channels we can clearly identify the CD19 and CD8 positive populations with no double positive cells (C).
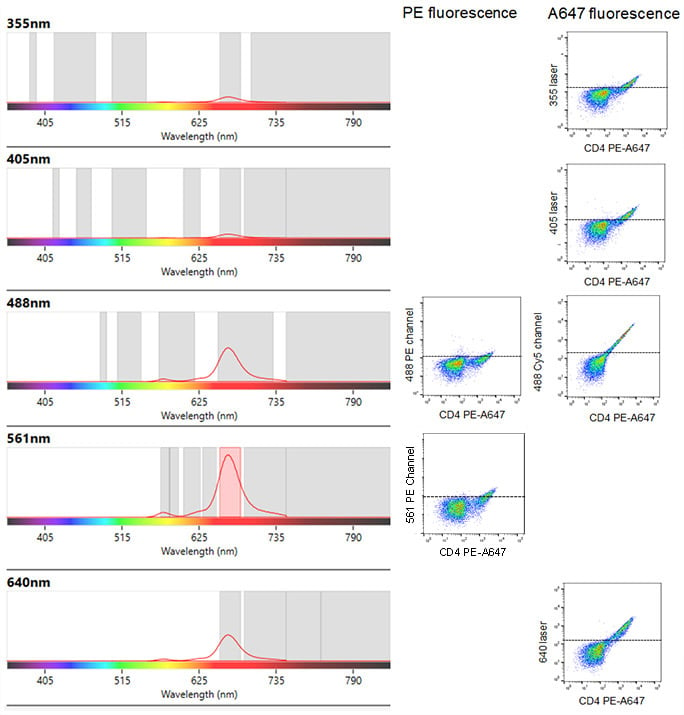
In addition to fluorescence spillover from one laser there is also the added problem of cross-laser excitation. This is where a fluorophore is also excited by an additional laser than the intended. It is very important for the fluorescence from single color controls to be measured on all the channels you intend to use. An example of this is shown in Figure 5 where lymphocytes were stained with CD4 PE-Alexa-Fluor 647 and acquired on the ZE5™ Cell Analyzer with every detector activated. The spectra viewer (Figure 5) shows the predicted cross laser excitation on the left, with the actual data shown by dot plots on the right. In addition to the intended fluorescence from Alexa Fluor 647 detected at 665 nm on the 561 nm laser, fluorescence is also detected at 665 nm from the 355 nm, 405 nm, 488 nm and 640 nm lasers. Furthermore, due to this fluorophore being a PE based tandem, there is fluorescence at 578 nm from the 561 nm and 488 nm lasers.

Fig. 5. Spectral viewer image from the ZE5 Cell Analyzer (left) with the corresponding uncompensated two color dot plots (right). Human peripheral blood lymphocytes were stained with CD4 PE-Alexa Fluor 647 and the cross-laser excitation of the fluorophore revealed. Although specific staining and fluorescence can be seen at 665 nm from the 561 nm laser excitation of PE-Alexa Fluor 647, excitation of free PE leading to emission at 578 nm is observed. There is also excitation, albeit weaker, of PE by the 488 nm laser leading to emission at both 578 nm (PE) and 665 nm (PE-Alexa Fluor 647). Furthermore there is excitation of Alexa Fluor 647 by the 355 nm, 405 nm and 640 nm laser leading to fluorescence at 665 nm. This is why compensation is required.
Further Reading
More information on fluorophores, fluorescence and compensation can be found in our popular flow guide and by watching our recent webinar.
To determine specific binding you may want to include isotype controls. When performing multicolor flow cytometry, there are also several other important considerations. Careful sample preparation, Fc blocking, inclusion of a live/dead dye, doublet exclusion and using other appropriate controls are all important. For more information watch our flow cytometry webinar Optimize your Flow Cytometry or visit our application resources page.


