
Popular topics

-
References
Bonilla DL et al. (2020). Full spectrum flow cytometry as a powerful technology for cancer immunotherapy research. Front Mol Biosci 7, 612801.
Ferrer-Font L et al. (2020). Panel design and optimization for high‐dimensional immunophenotyping assays using spectral flow cytometry. Curr Protoc in Cytom 92, e70.
Nolan JP and Condello D (2013). Spectral flow cytometry. Curr Protoc Cytom Chapter: Unit 1, 27.
Robinson JP et al. (2004). Collection hardware for high speed multispectral single particle analysis. Cytometry 59A, 12-12.
Robinson JP (2019). Spectral flow cytometry — Quo vadimus? Cytometry Part A 95, 823-824.
An Introduction to Spectral Flow Cytometry
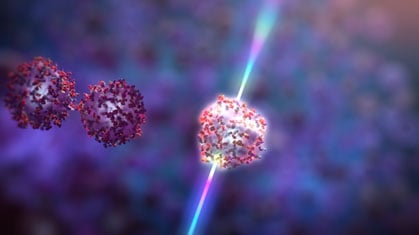
The application of spectral flow cytometry was initially presented by the Purdue group at the 2004 International Society for Analytical Cytology (ISAC) meeting (Robinson et al. 2004), with a patent issued for the technology to Purdue University in 2007 (Robinson 2019). Spectral flow cytometry is a rapidly growing area of flow cytometry and, in this blog, we look at the basic principles and the advantages over conventional flow cytometry.
Spectral flow cytometry differs from conventional flow cytometry as it uses prisms to capture all the emitted light from laser excited fluorophores across a set of detectors, or an array of channels, rather than detecting emitted photons that are collected into individual detectors (Figure 1). This means that while conventional flow cytometry effectively detects signals from specific fluorophores over defined wavelengths, spectral flow cytometry instead collects the entire spectral profile (also called a spectral signature) of fluorophores from multiple lasers.
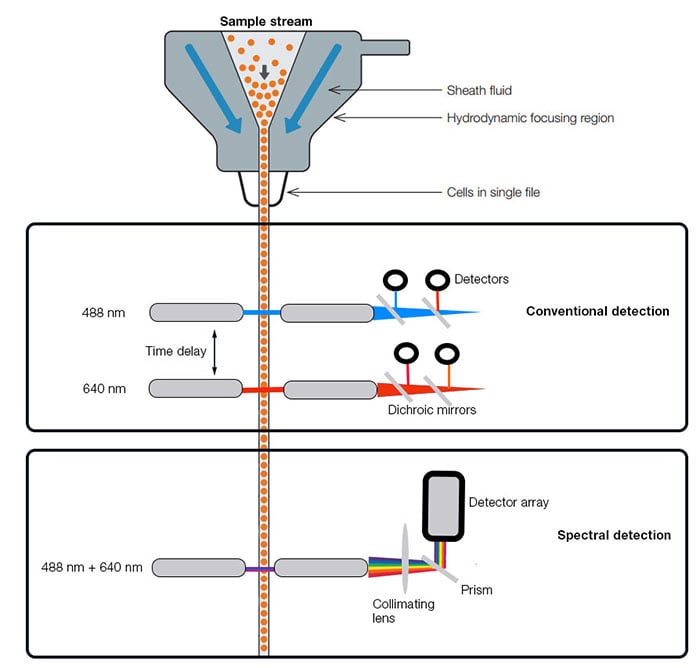
Fig. 1. Simplified comparison of conventional and spectral flow cytometer instruments for a 2-laser system (Adapted from Nolan and Condello 2013). Conventional detectors (top) use dichroic mirrors, bandpass, and long pass filters to separate colors of light for individual detection. Spectral detectors (bottom) use gratings or prisms to separate light and a collimating lens to parallelize and direct light linearly across an array of detectors.
How Do You Identify Individual Fluorophores?
In a multiparameter experiment, once you have collected the full spectrum data, individual fluorophores need to have their profiles isolated. This happens through a process called spectral unmixing and involves complex mathematical models that employ an unmixing algorithm. A distinct advantage compared with conventional multicolor flow cytometry is that, as long as fluorophores have distinct signatures across the spectrum, fluorophores with similar peak emission, like APC and Alexa Fluor 647, can be used in the same panel (Ferrer-Font et al. 2020). This is not possible using conventional flow cytometry as similar emission spectra would be detected in the same channel.
What Are the Advantages of Spectral Flow Cytometry?
For many years, a focus of flow cytometry evolution was on increasing the number of colors (spectral bands) able to be detected by cytometers. From 3-color panels possible in the 1980s to 8, 11, and then 17 colors possible by the early 2000s (Robinson et al. 2019). Today, multicolor panels with more than 30 parameters can be designed but further development in this area is impeded by the number of commercially available dyes that are compatible in the same panel.
In conventional flow cytometry, when emission peaks for different fluorophores are very close to each other they cannot be easily discriminated. However, as spectral flow cytometry enables the individual resolution of fluorophores with similar emission spectra, the number of markers possible in a multicolor panel can be greatly expanded to over 40+, with the theoretical limit around 60. This ability to add more markers to your panels enables further characterization of rare cell subsets and is a valuable technology for areas such as cancer immunotherapy research (Bonilla et al. 2020).
Using fluorophores with similar emission spectra but unique spectral signatures also enables flexibility, when selecting markers for your target of interest, as it increases the number of compatible, readily available antibodies from vendors. This includes Bio-Rad’s StarBright Dyes, which are available conjugated to a number of popular immunology markers such as CD4, CD14, and CD19.
One common issue in conventional flow cytometry is autofluorescence as this can impede data analysis — especially in larger and more granular cells. As spectral flow cytometry enables autofluorescence to be treated as ‘another color’, this source of background can be removed through spectral unmixing and analysis. This allows clearer identification of low-expressing targets and dim levels of fluorescence signal.
Considerations for Experimental Design
Many of the same principles that are important for the design of multicolor flow cytometry panels are also applicable for spectral flow cytometry. For example, you still need to be aware of the biology of your experiment, such as antigen density, and appropriate markers to define your cell population of interest. To ensure accurate resolution of your populations, you should also factor in any limitations of your instrument into your experiment design, as well as optimize your panel for factors like spillover spreading and matching fluorophore brightness and antigen expression (Ferrer-Font et al. 2020). The activation status of cells used as controls should also be considered for spectral flow cytometry. As cells become activated, their spectral properties change compared with resting cells. For this reason, it is recommended to have separate sets of controls for resting and activated cells. Using universal controls might lead to improper autofluorescence subtraction and lower data resolution. Finally, for single stain controls involving tandem dyes, it is recommended to use the same antibody and lot that will be used in the full panel; lot-to-lot variability and tandem dye breakdown greatly affect the spectral unmixing. Therefore, the use of different antibodies for compensation is not desirable, even when they are conjugated to the same fluorochromes.
StarBright Dyes in Spectral Flow Cytometry
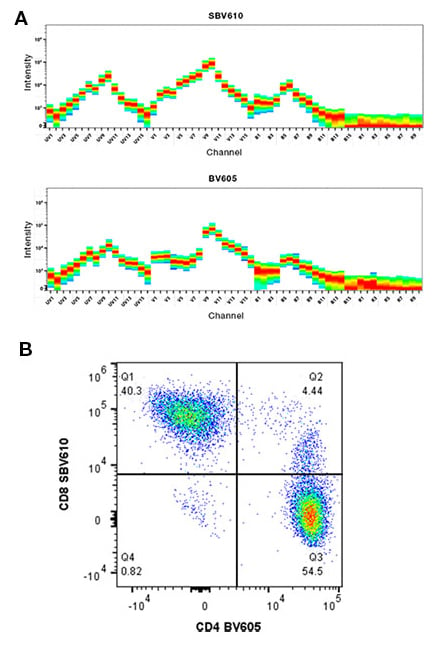
As discussed, for a fluorophore to be suitable for spectral flow cytometry, it needs to have a unique spectral signature. This means that many of our StarBright Dyes are ideal for use in spectral flow cytometry panels in combination with other dyes with similar emission spectra, including StarBright Violet 610 and Brilliant Violet 605 as markers in the same panel, as they have sufficiently different emission spectra (Figure 2).
Want to Know More about StarBright Dyes?
StarBright Dyes are Bio-Rad’s unique, proprietary, fluorescent nanoparticles that have been developed specifically for flow cytometry. They are bright with excitation and emission characteristics suitable for both conventional and spectral flow cytometry, have low lot-to-lot variation, can be used in all common staining buffers without the need for special buffers, and even be pre-mixed for use at a later date.
Learn MoreReferences
Bonilla DL et al. (2020). Full spectrum flow cytometry as a powerful technology for cancer immunotherapy research. Front Mol Biosci 7, 612801.
Ferrer-Font L et al. (2020). Panel design and optimization for high‐dimensional immunophenotyping assays using spectral flow cytometry. Curr Protoc in Cytom 92, e70.
Nolan JP and Condello D (2013). Spectral flow cytometry. Curr Protoc Cytom Chapter: Unit 1, 27.
Robinson JP et al. (2004). Collection hardware for high speed multispectral single particle analysis. Cytometry 59A, 12-12.
Robinson JP (2019). Spectral flow cytometry — Quo vadimus? Cytometry Part A 95, 823-824.
You may also be interested in...

View more Applications or Flow Cytometry blogs
