
Protocol: Method to Determine LD50 Using alamarBlue
Overview
alamarBlue can be used to determine the median lethal dose LD50 value and similar assays testing the effects of a toxin, radiation, or pathogen on cell cultures.
Percentage difference in reduction (equation 5) |
= |
A LW - ( A HW x R O ) for test well A LW - ( A HW x R O ) for control well |
x100
|
|---|
Use semi-log graph paper to plot the percent of untreated control (using equation 5) for each dilution of a given test agent on the y-axis vs. the concentration of the test agent on the x-axis.
To determine the LD50 endpoint from the graph, read from where the 50 percent point intercepts the dose.
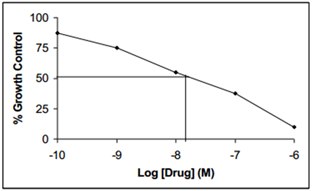
Response curve to the concentration along the x-axis. This concentration is the LD50 value.
Protocols for alamarBlue
Related Products
Cell Proliferation Products and Tips
Cell proliferation is a homeostatic process that involves the rapid growth and division of cells. If not properly controlled, it can lead to an unchecked increase in cell numbers, which may result in diseases such as cancer. Therefore, evaluating proliferation is crucial across various scientific fields.
This guide provides the knowledge you need to effectively study cell proliferation in your assays.