
Technical Note: Optimizing Overnight Staining Protocols Using StarBright Dye-Conjugated Antibodies
Abstract
 Technical Note:
Optimizing Overnight Staining Protocols Using StarBright™ Dye-Conjugated Antibodies
Recent advances in flow cytometry have enabled complex experiments that measure more parameters using a single sample. Despite these developments, traditional antibody staining protocols have remained largely unchanged, typically involving a 30–60 min antibody incubation step.
In 2022, an alternative overnight staining protocol was published,1 and it is gaining popularity owing to improved results in staining quality as well as cost reductions.
This method offers enhanced sensitivity, reduced variability, and lower background staining and requires less antibody, thereby decreasing costs. Additionally, it increases flexibility for scheduling longer experiments across two days. Here, we explore the benefits of this approach in detail with a practical example using StarBright Dye-conjugated antibodies. We describe how to optimize an overnight staining protocol and the key considerations required for its successful implementation.
Introduction
In flow cytometry, high-parameter panels require meticulous design with careful selection of appropriate antibody and fluorophore combinations. Antibody clones vary in how strongly they interact with their antigen targets, which is known as antibody binding affinity. As antibody-antigen interactions are reversible processes, antibodies with lower affinities exhibit increased rates of association and dissociation, often failing to reach equilibrium within standard incubation periods of 30 to 60 min.
However, pairing lower-affinity antibodies with brighter fluorophores means that the signal can be detected even with fewer antibodies bound to the antigen. Longer incubation times can also enhance the signal, as binding kinetics allow for equal staining intensity with fewer antibodies over a longer duration.2 With this approach, antibody binding equilibrium is achieved while less antibody is used, experimental variability is reduced, and sensitivity for certain markers is increased. Implementing an extended antibody incubation time in an overnight staining protocol requires careful design. Table 1 outlines five experimental considerations addressed in this study. This application note discusses key factors affecting staining outcomes and presents data comparing an optimized 24 hr protocol at 4°C with a 1 hr room temperature staining of the same panel.
Table 1. Technical considerations for an overnight staining protocol.
Factor |
Technical Consideration |
|---|---|
|
Sample viability |
Consider fixing cells prior to antibody incubation—prolonged incubation can decrease cell viability Use complete culture media if cells are not fixed—improves viability during long incubations Include a viability dye—enables removal of dead cells during analysis |
|
Staining temperature |
Stain fresh samples at 4°C—slows down cell degradation and reduces nonspecific binding |
|
Marker expression changes |
Fix cells prior to staining—prevents any changes in marker expression |
|
Epitope stability |
Select an appropriate fixation reagent and determine if the antibodies give a signal after fixation comparable to unfixed cells—ensures that the antibody can still recognize its epitope |
|
Antibody concentration |
Titrate antibodies to determine optimal dilution—longer incubation times often reduce the amount of antibody required |
Materials and Methods
1 Hr Staining Protocol
Frozen human peripheral blood mononuclear cells (PBMCs) were thawed rapidly in medium (RPMI 1640 ATCC Modification Media, Gibco, A10491-01) supplemented with 10% fetal bovine serum (FBS; Corning, 35-016-CV), centrifuged at 300–400 x g for 5 min at room temperature (RT), and washed with phosphate buffered saline (PBS). The cells were resuspended in PBS, added at a density of 1 x 10⁶ cells per well to 96-well plates, and incubated at RT with VivaFix 410/450 Cell Viability Assay (Bio-Rad Laboratories, Inc., catalog 1351112). After 30 min, the cells were washed with PBS + 1% bovine serum albumin (PBS/BSA) and blocked in Human Seroblock (Bio-Rad, BUF070B) for 10 min at RT. The cells were washed with PBS/BSA and incubated with the antibody panel (Table 2) for 1 hr at RT in the dark. For compensation controls, cells were incubated with a single antibody or VivaFix alone. Following incubation, the samples were washed three times in PBS/BSA and resuspended in 100 μL PBS/BSA. All antibodies were titrated before use and used at the highest stain index value.
24 Hr Staining Protocol
Frozen PBMCs were thawed rapidly in medium, centrifuged, and washed with PBS. The cells were resuspended in PBS, added at a density of 1 x 10⁶ cells per well to 96-well plates and incubated at RT with VivaFix 410/450 Cell Viability Assay. After 30 min, the cells were washed and incubated in 200 μL fixation buffer (PBS + 0.2% paraformaldehyde (PFA)) for 20 min at RT. The cells were washed twice in medium and incubated with the antibody panel (Table 2) for 24 hr at 4°C in the dark. For compensation controls, cells were incubated with a single antibody or VivaFix alone. Following incubation, the samples were washed three times in PBS/BSA and resuspended in 100 μL PBS/BSA. All antibodies were titrated before use and used at the highest stain index value. Cells from the same donor as used for the 1 hr staining protocol were used to allow for accurate comparisons.
Time Course
Human peripheral blood was treated with Erythrolyse Red Cell Lysing Buffer (Bio-Rad, BUF04) to remove red blood cells. The remaining white blood cells were incubated with Mouse Anti-Human CD4 Monoclonal Antibody conjugated to StarBright Blue 580 (clone RPA-T4; Bio-Rad, MCA1267SBB580) in PBS/BSA at 4°C in the dark before or after fixation with PBS + 0.2% PFA for 20 min and washing with PBS/BSA. Following a 0–24 hr incubation, the samples were washed three times in PBS/BSA and resuspended in 200 μL PBS/BSA.
Table 2. Reagents used in the multiplex panel.
Marker |
Fluorophore |
Bio-Rad Catalog |
Volume for 1 Hr Staining, μL |
Volume for 24 Hr Staining, μL |
|---|---|---|---|---|
|
CD14 |
SBUV400 |
5 |
1 |
|
|
CD45RA |
SBUV665 |
5 |
1 |
|
|
CD25 |
SBV515 |
10 |
5 |
|
|
CD45RO |
SBV610 |
5 |
2 |
|
|
CD56 |
A488 |
5 |
2 |
|
|
CD4 |
SBB580 |
5 |
1 |
|
|
CD27 |
SBB675 |
5 |
2 |
|
|
CD19 |
SBB810 |
1 |
0.5 |
|
|
CD20 |
SBY605 |
5 |
1 |
|
|
CD127 |
PE |
5 |
2 |
|
|
CD3 |
SBY720 |
10 |
5 |
|
|
CD16 |
A647 |
10 |
2 |
|
|
CD8 |
SBR815 |
5 |
0.5 |
|
|
VivaFix 410/450 |
N/A |
1 |
1 |
|
|
Total |
|
|
77 |
26 |
A488, Alexa Fluor 488; A647, Alexa Fluor 647; PE, phycoerythrin; SBB, StarBright Blue; SBR, StarBright Red; SBUV, StarBright UltraViolet; SBV, StarBright Violet; SBY, StarBright Yellow.
Titration
Following the 1 hr or 24 hr protocol, PBMCs were incubated with each antibody in the panel at doubling dilution concentrations starting at 10 μL in 100 μL staining buffer. Stain index calculations were determined for each condition using the following equation:
- Median fluorescence intensity (MFI) of positive population – MFI of negative population / (2x robust standard deviation of negative population)
The optimal antibody concentration is typically determined by the highest stain index, reflecting maximal positive-negative separation with minimal background. In some cases, a lower concentration that maintains clear separation may be selected to reduce spreading.
Data Collection
Cells were acquired on a ZE5 Cell Analyzer, 5 laser (Bio-Rad, 12004279). In total, 60,000 cells were acquired for the time course and titration experiments; 150,000 cells were acquired for the multiplex panel, including the single-stained controls.
Gating Strategy
Analysis was performed using FCS Express 7 (DeNovo Software by Dotmatics). When a viability dye was included, dead cells were first excluded from downstream analysis by gating on cells negative for the viability dye. Doublet discrimination was used to identify single cells, followed by gating on lymphocyte and monocyte populations based on the forward scatter area (FSC-A) and side scatter area (SSC-A).
Results
Effect of Incubation Time on Antibody Staining
A proof-of-concept experiment was performed to examine how extending the incubation time affects staining of human peripheral blood. Three amounts of Mouse Anti-Human CD4 Monoclonal Antibody conjugated to StarBright Blue 580 (Bio-Rad, MCA1267SBB580) were used to compare two protocols (see Figure 1):
- Unfixed cells: stained for 1 hr
- Fixed cells: stained for 30 min, 45 min, 1 hr, 2 hr, 4 hr, 18 hr, and 24 hr
Regardless of the amount of antibody used, unfixed and fixed cells showed identical results after staining for 1 hr. However, differences in fixed cells became apparent when comparing the longer incubation times. A distinct separation was observed for all concentrations by 4 hr, and the stain index increased with time, except for 5 μL, which had reached a plateau by this time point. The stain index data indicated that 24 hr is the optimal time for staining at lower concentrations. While a 24 hr time point was used in this study, an 18 hr duration was also effective; this time period also has the added benefit of fitting into a typical work schedule, starting at the end of one day and finishing at the start of the following day.
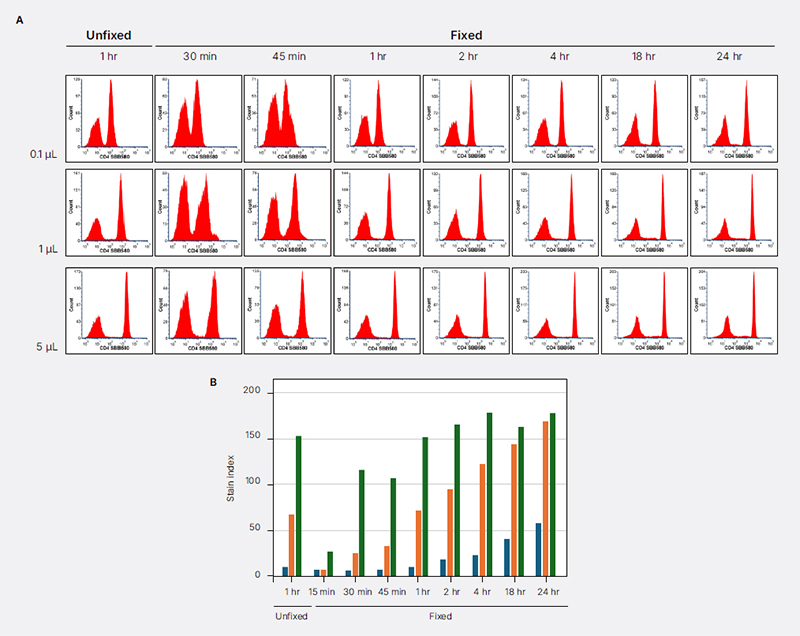
Fig. 1. Effect of incubation time and concentration on CD4 SBB580 staining.
Red blood cell-lysed human blood was stained for 1 hr with Mouse Anti-Human CD4 Monoclonal Antibody conjugated to StarBright Blue 580 (clone RPA-T4; Bio-Rad, MCA1267SBB580) (unfixed) or after fixation with 0.2% paraformaldehyde (fixed) with increasing incubation time. A, Histograms showing the CD4 signal on single lymphocytes at 0.1, 1, and 5 μL of 1 mg/mL antibody in 100 μL staining solution at various time points. B, Stain index calculations using 0.1 (
■
), 1 (
■
), and 5 (
■
) μL of 1 mg/mL antibody in 100 μL staining volume. SBB, StarBright Blue.
Effect of Cell Fixation on Antibody Staining
The proof-of-concept time-course experiment was performed using freshly drawn human blood. To enable the use of blood from the same donor for optimization and the final experiment, all subsequent staining was performed using PBMCs that had been frozen.
Nonfixed cells, especially thawed PBMCs, may lose viability and marker expression over time, which can be prevented by fixation. However, as fixation may alter epitopes and reduce antibody binding, the fixative concentration was optimized.
Frozen PBMCs were stained with Mouse Anti-Human CD27 Monoclonal Antibody conjugated to StarBright Blue 675 (clone LT27; Bio-Rad, MCA755SBB675) after fixation in increasing concentrations of PFA and compared to nonfixed samples. Fixation in PFA prevents cell death. As shown in Figure 2, fixation in 0.2% PFA for 20 min led to results comparable to those for nonfixed samples, whereas higher concentrations had a detrimental effect on separation of the positive population. Similar effects of higher PFA concentrations were observed with other antibodies (data not shown). Therefore, 0.2% PFA was utilized in all subsequent experiments.
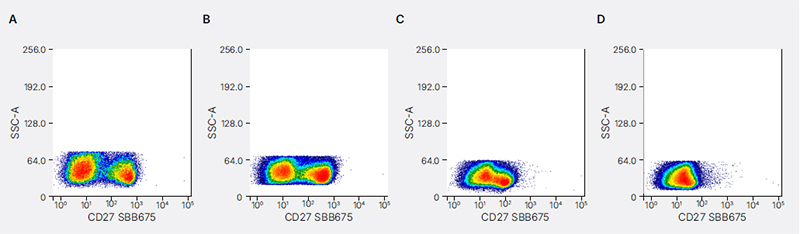
Fig. 2. Effect of fixation on CD27 SBB675 staining.
Human peripheral blood mononuclear cells were stained for 24 hr at 4°C with Mouse Anti-Human CD27 Monoclonal Antibody conjugated to StarBright Blue 675 (clone LT27; Bio-Rad, MCA755SBB675) before or after fixation with 0 (A), 0.2 (B), 2 (C), or 4% (D) PFA. Data shown are from single lymphocytes. SBB, StarBright Blue; SSC-A, side scatter area.
Antibody Titration
Antibodies must be titrated to determine the optimal concentration that will generate high-quality data. Insufficient antibody concentrations can result in a weak signal and the inability to resolve low antigen-expressing markers, whereas excessive amounts may lead to increased background staining and greater spread in multiplexing panels. For this study, all antibodies were titrated using the 1 hr and 24 hr staining protocols. It is important that antibody titrations are performed using the exact protocol as used in the final experiment (including incubation time, temperature, volume, and sample type) because antibody-antigen binding is sensitive to these experimental variables. Indeed, changes in these conditions can alter antibody binding kinetics, specificity, and background staining, thereby affecting the optimal antibody concentration.
Figure 3 demonstrates that higher amounts of CD8 SBR815 (clone LT8; Bio-Rad, MCA1226SBR815) antibody led to increased signal in the negative population when using both protocols: as the antibody amount decreased, the background staining in the negative population also decreased.
The maximum stain index was achieved using 5 μL and 0.63 μL of antibody to stain 100 μL of cells for the 1 hr and 24 hr protocols, respectively. As can be observed in Figure 3B, 1.25 μL and 2.5 μL may also be suitable volumes to use, as they resulted in high stain index values.
For all antibodies tested, the quantity required for 24 hr staining was either equivalent to or up to 10 times less than that needed for 1 hr staining (Table 2).
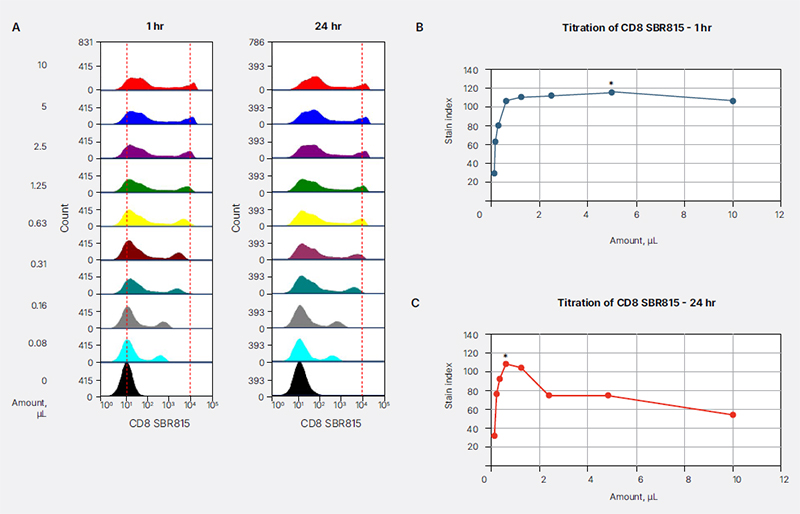
Fig. 3. Titration of CD8 SBR815 using the 1 hr or 24 hr staining protocol for frozen PBMCs.
A, decreasing amounts of Mouse Anti-Human CD8 Monoclonal Antibody conjugated to StarBright Red 815 (clone LT8; Bio-Rad, MCA1226SBR815) were added to a total staining volume of 100 μL. To allow comparisons between the histograms, values at 101 and 104 (
---
) are shown. B and C, the highest stain index value (*) for each protocol is indicated. SBR, StarBright Red.
Immunophenotyping Panel Data from the 1 Hr and 24 Hr Staining Protocols
PBMCs were stained with the antibody panel for either 1 or 24 hr using antibody concentrations determined by titration for each protocol. The panel was designed to identify the major lymphocyte and monocyte populations present in human blood as well as small subpopulations such as regulatory T cells (T regs) and different memory T cell populations (Figures 4 and 5).
To enable accurate gating of the T reg population, a CD25 fluorescence minus one (FMO) control for both panels that contained all antibodies in the panel except CD25 was included (Supplementary Figure 1). The spillover and spillover spreading matrices obtained are shown in Supplementary Tables 1–4.
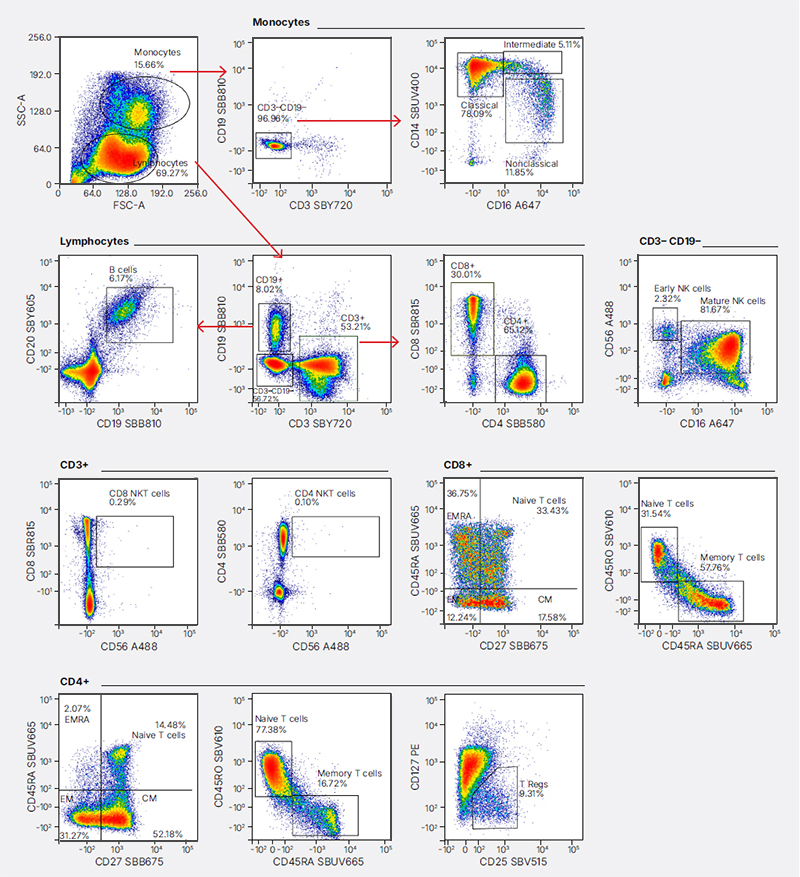
Fig. 4. Immunophenotyping data from PBMCs stained for 1 hr.
Human peripheral blood mononuclear cells were stained with a panel (Table 2) for 1 hr at room temperature. Gating was first performed on live, single cells (data not shown). Data were acquired on a ZE5 Cell Analyzer. A488, Alexa Fluor 488; A647, Alexa Fluor 647; CM, central memory cells; EM, effector memory cells; EMRA, effector memory re-expressing CD45RA T cells; FSC-A, forward scatter area; NK, natural killer; PE, phycoerythrin; SBB, StarBright Blue; SSC-A, side scatter area; SBR, StarBright Red; SBUV, StarBright UltraViolet; SBV, StarBright Violet; SBY, StarBright Yellow; T regs, regulatory T cells.
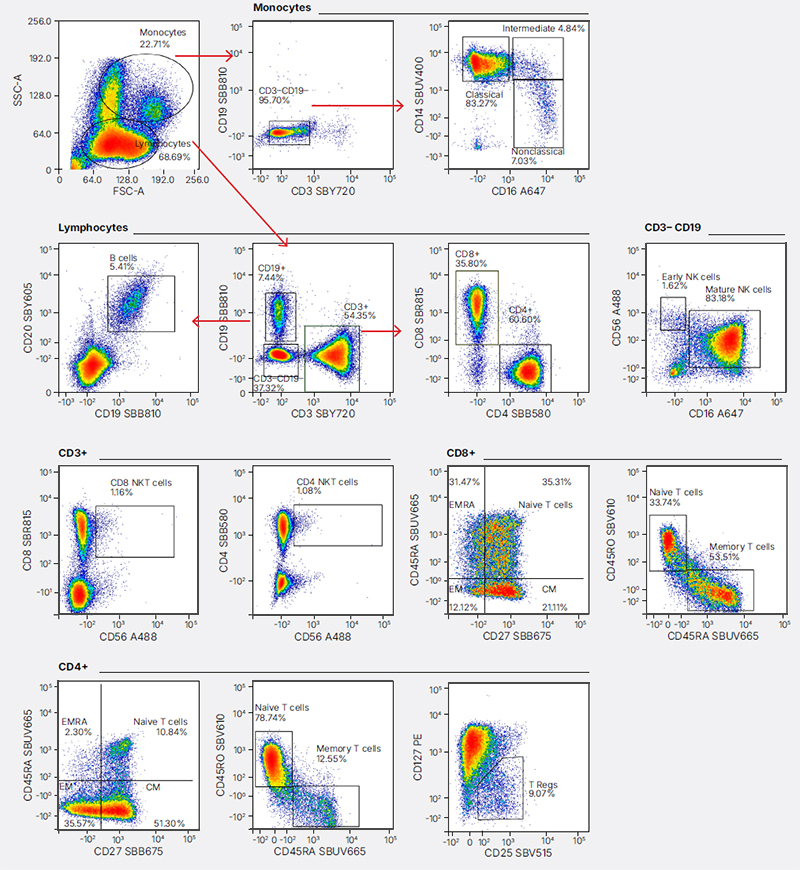
Fig. 5. Immunophenotyping data from PBMCs stained for 24 hr.
Human peripheral blood mononuclear cells were stained with a panel (Table 2) for 24 hr at 4°C. Gating was first performed on live, single cells (data not shown). Data were acquired on a ZE5 Cell Analyzer. A488, Alexa Fluor 488; A647, Alexa Fluor 647; CM, central memory cells; EM, effector memory cells; EMRA, effector memory re-expressing CD45RA T cells; FSC-A, forward scatter area; NK, natural killer; PE, phycoerythrin; SBB, StarBright Blue; SSC-A, side scatter area; SBR, StarBright Red; SBUV, StarBright UltraViolet; SBV, StarBright Violet; SBY, StarBright Yellow; T regs, regulatory T cells.
Comparisons of Immunophenotyping Panel Data from the 1 Hr and 24 Hr Staining Protocols
The data from the two panels were comparable, with the expected populations being identified. As seen in the FSC/SSC gate, differences in the distribution of the major populations were observed (Figure 6A). This was due to the fixation step in the 24 hr staining protocol, as fixation can change cell shape, reduce cell size, increase cell transparency, and affect internal cell structures, altering cell position in the FSC/SSC gate.
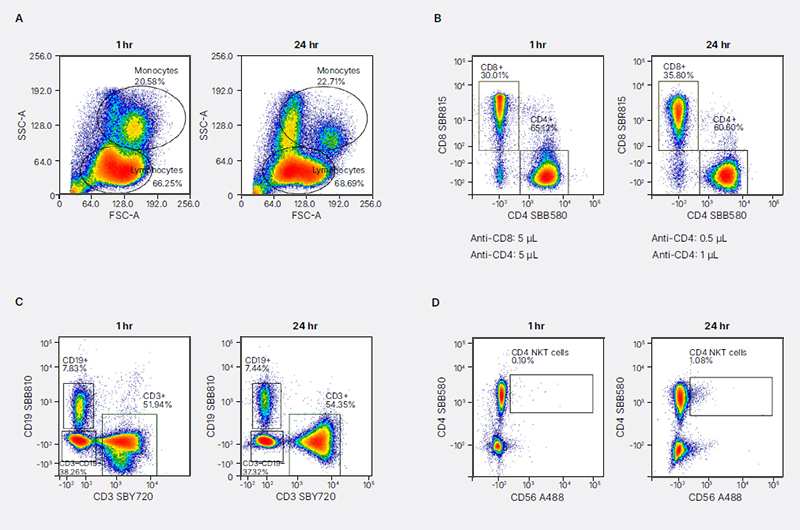
Fig. 6. Differences between immunophenotyping data from PBMCs stained using a 1 hr or 24 hr staining protocol.
A, effect of fixation on FSC/SSC. B, effect of different antibody concentrations. C, differences in spreading. D, differences in detection of cell populations. A488, Alexa Fluor 488; FSC-A, forward scatter area; NK, natural killer; SBB, StarBright Blue; SSC-A, side scatter area; SBR, StarBright Red; SBY, StarBright Yellow.
Although lower amounts of antibody were used in the 24 hr protocol, better separation of positive and negative populations was achieved. Side-by-side comparisons for CD8 vs. CD4 and CD3 vs. CD19 are shown in Figure 6B and C, respectively. The stain index also increased for all antibodies except CD16 SBUV400 and CD14 A647 in the 24 hr protocol (Figure 7). In addition, the 24 hr staining protocol resulted in tighter positive populations, with fewer cells as outliers in the gating strategy (Figures 6B and C).
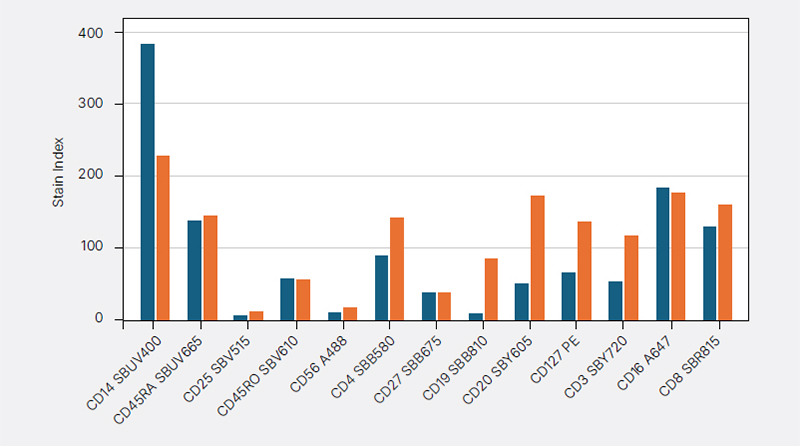
Fig. 7. Comparison of stain index values for all antibodies using a 1 hr or 24 hr staining protocol.
Stain index values were calculated from the single-stained controls used in the final panels for the 1 hr (■)
and 24 hr (■) protocols. A488, Alexa Fluor 488; A647, Alexa Fluor 647; PE, phycoerythrin; SBB, StarBright Blue; SBR, StarBright Red; SBUV, StarBright UltraViolet; SBV, StarBright Violet; SBY, StarBright Yellow.
Overall, spreading was similar between the two panels, though some differences were observed. For example, negative spread was reduced for the CD19 and CD20-negative population (Figures 4 and 5), but there was increased spread between CD3 and CD19-positive cells (Figure 6C). Supplementary Tables 2 and 4 depict the similarity in spreading. No significant variation in the percent positive of major cell populations was detected (Figure 8), apart from CD4+ and CD8+ natural killer (NK) T cells (Figure 6D). We attribute this result to the enhanced brightness of CD56 staining with the 24 hr protocol.
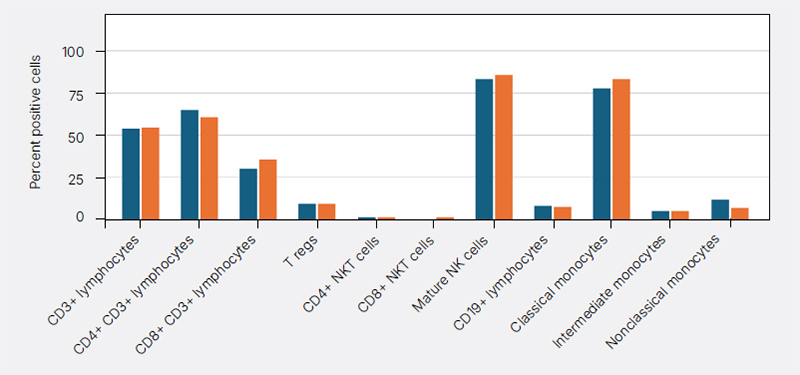
Fig. 8. Comparison of population percentages using a 1- or 24-hr staining protocol.
Percentages determined from the final panels are shown for the 1 hr (■)
and 24 hr (■) protocols. NK, natural killer; T regs, regulatory T cells.
Conclusion
Overnight staining protocols are suitable for use with StarBright Dye-conjugated antibodies. Compared to traditional shorter incubation methods, longer staining offers improved sensitivity and reduced background noise while enabling the use of lower antibody volumes and concentrations and providing practical scheduling flexibility for complex experiments. The benefits of increased antibody incubation times are summarized in Table 3. In addition to the immunophenotyping data provided herein, an overnight staining protocol has been shown to be suitable for intracellular staining protocols to detect cytokines, transcription factors, and other intracellular proteins.1
Table 3. Benefits of overnight staining.
Benefit |
Description |
|---|---|
|
Improved sensitivity |
Longer incubation allows antibodies more time to bind, especially for low abundance or hard-to-access antigens, enhancing signal intensity, e.g., the CD56 antibody |
|
Lower antibody concentration |
Significantly less antibody can be used while still achieving strong staining, which saves money, especially with high-parameter panels (Table 2) |
|
Better reproducibility |
Extended incubation minimizes the variability caused by timing inconsistencies, temperature fluctuations, or user error during short staining times. As antibody binding will be at or close to equilibrium, the signal is more stable1 |
|
Convenience |
Stain today, run tomorrow. This frees up cytometer time and avoids late-night sample runs, when fatigue can lead to mistakes |
We have shown that extended antibody incubation times lead to a brighter signal when using fluorescently conjugated antibodies, with more antibodies bound. Thus, the same or higher signal intensity with less antibody can be achieved, reducing costs.
The success of overnight staining relies on careful consideration of factors such as antibody titration, epitope stability, fixation, temperature, and panel design. Equal benefits might not be obtained for all antibody clones or epitopes, and some protocol changes may be needed, especially if fixation affects antigen accessibility.
In summary, overnight staining protocols provide a powerful tool for researchers seeking higher sensitivity, reproducibility, and efficiency in flow cytometry while reducing costs. With appropriate optimization and validation, this approach can streamline workflows and enhance data quality in both routine and advanced cytometry experiments.
Supplementary Data
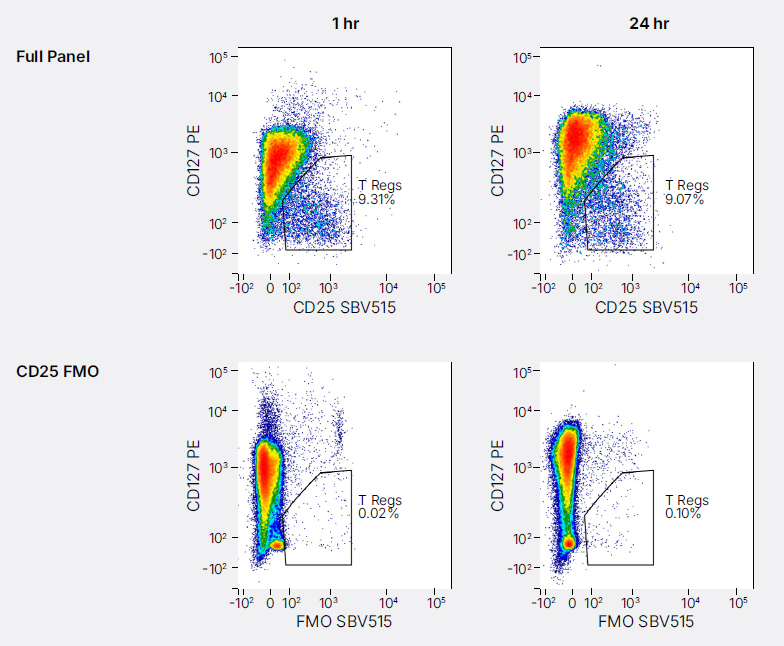
Suppl. Fig. 1. CD25 fluorescence minus one (FMO) controls and gates used to detect T regs.
Human peripheral blood mononuclear cells were stained with the full staining panel or CD25 FMO panel using the 1 hr or 24 hr staining protocol. Gating was performed on live, single CD3+CD4+ lymphocytes. PE, phycoerythrin; SBV, StarBright Violet; T regs, regulatory T cells.
Suppl. Table 1. The 1 hr staining panel spillover matrix.
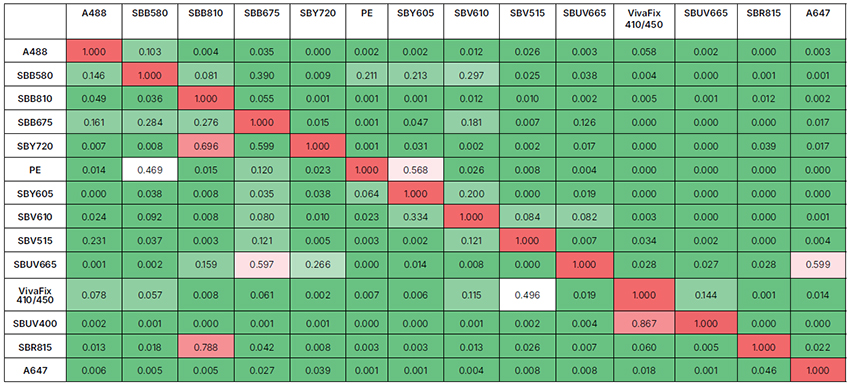
Values represent the amount of spillover for each fluorophore. The rows show the fluorophore, and the columns display the signal present in each detector. Colors progress from green to white to red as more spillover is present. Green indicates no or very low spillover, whereas red shows greater spillover between the two fluorophores. A488, Alexa Fluor 488; A647, Alexa Fluor 647; PE, phycoerythrin; SBB, StarBright Blue; SBR, StarBright Red; SBUV, StarBright UltraViolet; SBV, StarBright Violet; SBY, StarBright Yellow.
Suppl. Table 2. The 1 hr staining panel spillover spreading matrix.
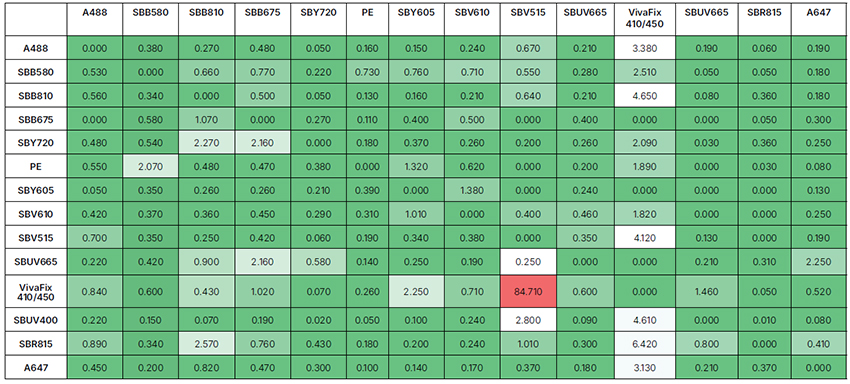
Values indicate the amount of spillover spreading (SS) for each fluorophore across all detectors. The rows show the fluorophore-donated SS, and the columns display the detector-collected SS. Colors progress from green to white to red as more spreading is present. Green indicates no or very low spreading, whereas red notes more spreading is present. 0–3 indicates no or very low spreading. A488, Alexa Fluor 488; A647, Alexa Fluor 647; PE, phycoerythrin; SBB, StarBright Blue; SBR, StarBright Red; SBUV, StarBright UltraViolet; SBV, StarBright Violet; SBY, StarBright Yellow.
Suppl. Table 3. The 24 hr staining panel spillover matrix.
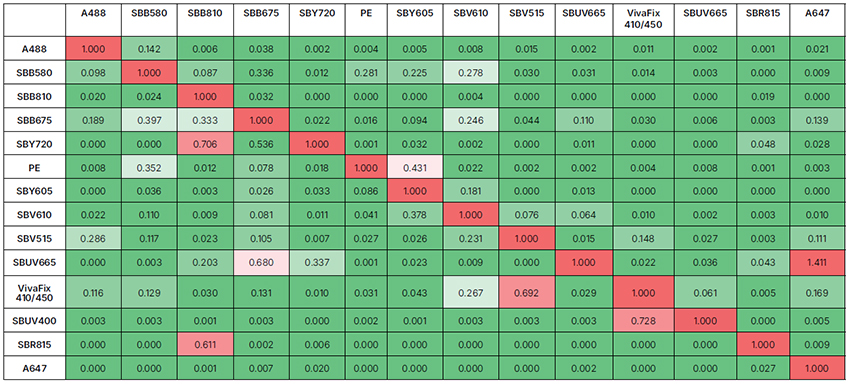
Values represent the amount of spillover for each fluorophore. The rows show the fluorophore, and the columns display the signal present in each detector. Colors progress from green to white to red as more spillover is present. Green indicates no or very low spillover, whereas red shows greater spillover between the two fluorophores. A488, Alexa Fluor 488; A647, Alexa Fluor 647; PE, phycoerythrin; SBB, StarBright Blue; SBR, StarBright Red; SBUV, StarBright UltraViolet; SBV, StarBright Violet; SBY, StarBright Yellow.
Suppl. Table 4. The 24 hr staining panel spillover spreading matrix.
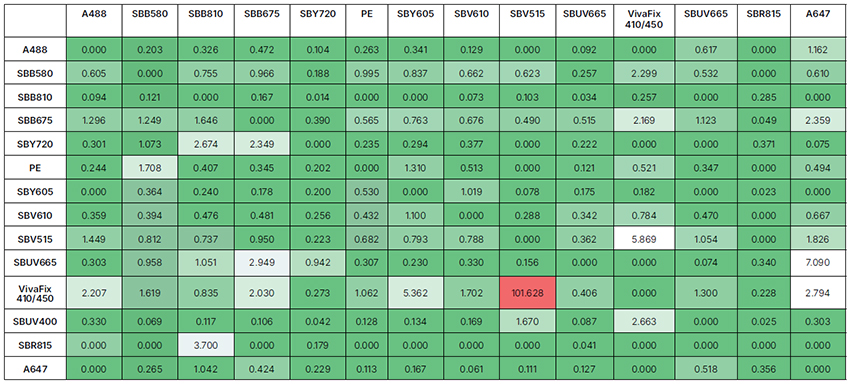
Values indicate the amount of spillover spreading (SS) for each fluorophore across all detectors. The rows show the fluorophore-donated SS, and the columns display the detector-collected SS. Colors progress from green to white to red as more spreading is present. Green indicates no or very low spreading, whereas red notes more spreading is present. 0–3 indicates no or very low spreading. A488, Alexa Fluor 488; A647, Alexa Fluor 647; PE, phycoerythrin; SBB, StarBright Blue; SBR, StarBright Red; SBUV, StarBright UltraViolet; SBV, StarBright Violet; SBY, StarBright Yellow.
References
- Whyte CE et al. (2022). Do more with less: Improving high parameter cytometry through overnight staining. Curr Protoc 2, e589.
- Andersson K et al. (2010). Antibody-antigen interactions: What is the required time to equilibrium? Nat Preced 45, 486–505.
Resources for Flow Cytometry
- StarBright Dyes
- Multicolor Panel Building
- Sample Preparation
- Controls
- Fluorescence Spectraviewer
- Panel Builder