-
US | en
- Products
- Applications
- Flow Cytometry
- Flow Cytometry Explained
- Flow Cytometry Basics Guide
- Chapter 3 - Data Analysis
- Single-Parameter or Univariate Histograms

Single-Parameter or Univariate Histograms
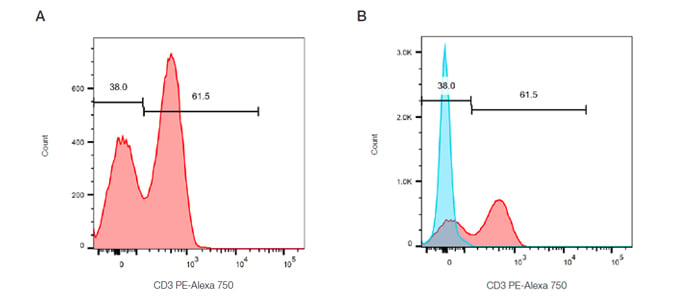
These are histograms that display a single measurement parameter (relative fluorescence or light scatter intensity) on the x-axis and the number of events (cell count) on the y-axis. The data is expressed in a histogram which can be all the data collected or a selected (gated) population. While simple, it is useful for evaluating the total number of cells in a sample that possesses the selected physical properties or express the marker of interest. Cells with the desired characteristics are called the positive dataset. An example can be seen in Figure 15. Peripheral blood was stained for CD3 and then gated on the lymphocytes using forward and side scatter. There are two peaks which can be interpreted as the positive and negative dataset. In this example the CD3 positive T cells represent around 61% of the cells within the lymphocyte gate.

Fig. 15. Single parameter histograms. A. Cells within the lymphocyte gate defined in Figure 13A are represented in a histogram to evaluate the relative expression of CD3 (MCA463P750). B. Overlay of a control population onto the stained population allows easy identification of the positive cells.
Gaining Accuracy
In order to accurately identify the positive dataset, flow cytometry should be repeated in the presence of appropriate controls, discussed in a later chapter. This is particularly necessary if a single distinct peak is observed, however often in flow cytometry multiple peaks are observed due to mixed populations. Figure 15B shows a control histogram (in this case an isotype control), in blue, overlaid onto the stained positive dataset, in red, allowing the background staining levels to be accurately defined.
Using analytical software, measurements and statistics can be obtained for many parameters in addition to the number of cells and percentage of cells within the gate. This can include measurements such as median and mean fluorescence intensity (MFI) often used when there are small increases or decreases in fluorescence.
