-
US | en

Gates and Regions
Flow cytometry data analysis is fundamentally based upon the principle of gating. Gates and regions are placed around populations of cells with common characteristics, usually forward scatter, side scatter and marker expression, to investigate and to quantify these populations of interest. Here we will show what the common flow cytometry graph outputs look like and how in a few simple steps you can identify different cell populations that have been stained with antibodies conjugated to fluorophores. In addition to this flow guide we have a handy PDF available to download on our gates, plots and regions page, which can be used as a quick reminder.
How to Gate
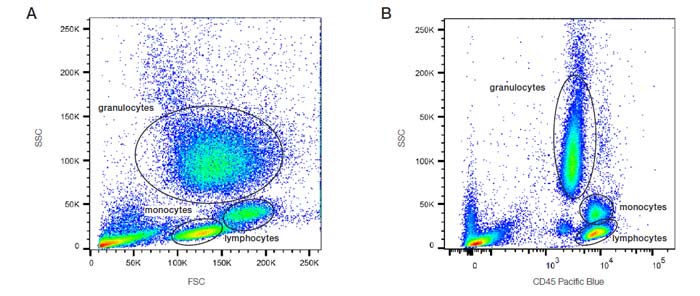
The first step in gating is often distinguishing populations of cells based on their forward and side scatter properties. Forward and side scatter give an estimation of the size and granularity of the cells respectively, although this can depend on several factors such as the sample, the wavelength of the laser, the collection angle and the refractive index of the sample and the sheath fluid. Distinguishing populations of cells can be relatively straight forward for cell lines where there is only one type of cell, but it can be more complex for samples where there are multiple cell types. As can be seen in the density plots in Figure 13, red cell lysed whole blood has several distinct populations. The red/yellow/green/blue hot spots indicate increasing numbers of events resulting from discrete populations of cells. The light scatter patterns of granulocytes, monocytes and lymphocytes allow them to be distinguished from cellular debris and dead cells. Debris and dead cells often have a lower level of forward scatter and are found at the bottom left corner of the density plot. The forward scatter threshold can be increased to avoid collecting these events, or they can be removed by gating on the populations of interest (Figure 13A). Data can also be plotted as a combination of fluorescence and forward or side scatter as seen with CD45 Pacific Blue in Figure 13B. Forward and side scatter gating is often used to remove dead cells which have increased autofluorescence and non-specific binding of antibodies however, including a viability dye is a much more reliable method.

Fig. 13. Analysis of lysed whole blood. A. SSC vs. FSC density plot: B. SSC vs. CD45 PB (MCA87PB) fluorescence plot. PB, Pacific Blue; FSC, forward scatter; SSC, side scatter.
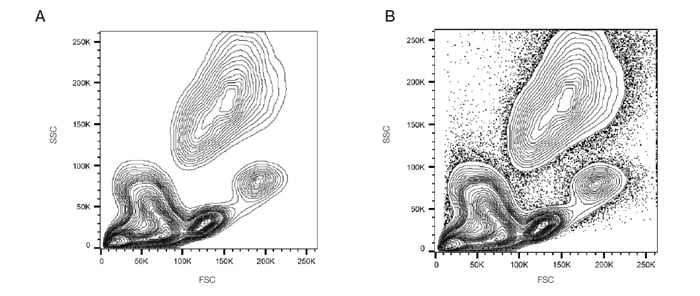
Events can also be displayed as a dot plot where no density information is shown or as a contour map to show the relative intensity of scatter patterns. Examples of contour maps are shown in Figure 14.

Fig. 14. Analysis of lysed whole blood. A. SSC vs. FSC contour plot: B. SSC vs. FSC contour plot plus outliers; FSC, forward scatter; SSC, side scatter.
It is down to the user preference as to which display is preferred, but sometimes discrete populations of cells are easier to visualize on contour diagrams.
