pSIVA™ Real-Time Apoptosis Kits
- On This Page
- Visualize apoptosis
- pSIVA™ real-time apoptosis fluorescent microscopy kit benefits
- You may also be interested in
- References
Visualize apoptosis by fluorescent microscopy as it happens
pSIVA™ Real-Time Apoptosis Kits
Microscopy Kit
Apoptosis, a programmed cell death mechanism, is an essential process in embryogenesis and development. The process is also critical for ensuring an organism’s health by removing aberrant or damaged cells. Apoptosis proceeds in several well defined stages that are characterized by distinct changes in cell morphology, which culminate in the engulfment of apoptotic bodies by macrophages (Elmore 2007).
One of the early apoptotic events is rearrangement of the plasma membrane’s phospholipid asymmetry. This change results in the exposure of phosphatidylserine (PS) at the outer plasma membrane (in healthy cells PS is restricted to the inner plasma membrane). Fluorophore labeled annexin V is traditionally used to assess changes to plasma membrane asymmetry by flow cytometry. The assay is based on the high binding affinity of annexin V in the presence of Ca2+.
The apoptosis process is however reversible up until the start of mitochondrial outer membrane permeabilization (MOMP), also known as “the point of no return" (Chipuk et al. 2006). Accordingly, PS exposure can be transient, a phenomenon known as “PS flipping" (Van der Mark et al. 2013). In contrast to Annexin V Apoptosis Kits, the pSIVA (polarity-Sensitive Indicator of Viability & Apoptosis; also described by Kim (2010b) as “a polarity-sensitive mutant version of annexin B12”) probe is conjugated to the green emitting IANBD dye, and only fluoresces when bound to PS (Figure 1, Kim et al. (2010a)). As in the case of annexin V, the binding of the pSIVA biosensor is dependent on Ca2+ (Kim et al. 2010b). The method therefore allows the analysis of kinetic apoptotic events in real time. Since no washing steps are required, you can simply add the probe and start analyzing.
- APO004 for the detection of apoptosis by fluorescence microscopy
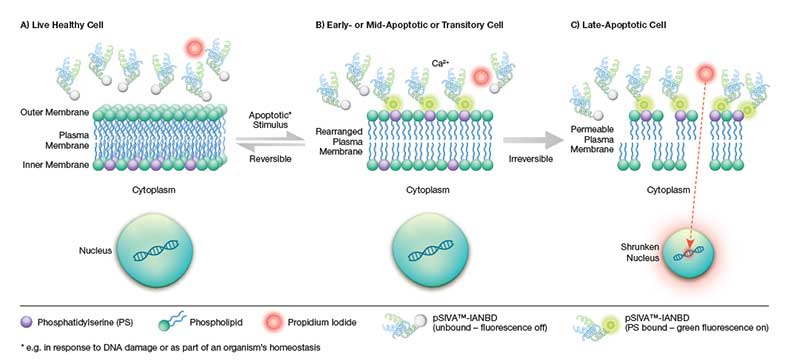
Fig.1. Schematic representation of the pSIVA-IANBD biosensor. B) Upon induction of apoptosis pathways, the plasma membrane becomes rearranged resulting in the exposure of phosphatidylserine (PS) on the outer plasma membrane. The pSIVA-IANBD probe binds to PS in the presence of Ca2+ and once bound starts to fluoresce green. A) In cases where the apoptosis program is halted and ultimately reversed, the pSIVA-IANBD probe dissociates and stops fluorescing thus enabling the analysis of transient apoptotic events. C) Once committed to apoptosis, the plasma membrane becomes permeable allowing the entry of cell viability dyes such as propidium iodide (PI). These dyes stain cells red by intercalating into DNA and are used to distinguish early apoptotic cells (pSIVA-IANBD: green) from late apoptotic and necrotic cells (PI: red).
pSIVA™ Real-Time Apoptosis Fluorescent Microscopy Kit benefits:
- Ideal for performing time-lapse live cell imaging experiments - visualize apoptosis events in real time
- Perfect for comparing mutant and wild type strains - observe transient and reversible apoptotic events
- No washing steps or special buffers required - just add the pSIVA probe and start imaging
- Differentiate apoptotic from necrotic/dead cells - the kit includes the viability dye propidium iodide (Figures 1 & 2)
-
Compatible with conventional fluorescence microscopes and the ZOE™ Fluorescent Imager (Figure 2) - IANBD (excitation maximum 488 nm, emission maximum 530 nm) can be easily detected by FITC filter sets
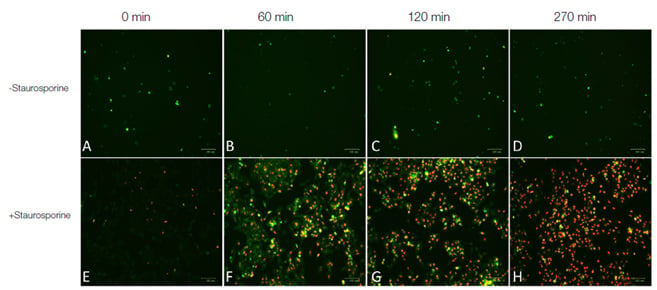
Fig.2. Real-time apoptosis imaging experiment. 1x10⁵ HeLa cells were seeded on Millicell® EZ Slide 4-well glass slides (sterile) and cultured in 0.5 ml RPMI medium supplemented with 2 mM CaCl2. Cells were treated with 1 μM of the apoptosis inducing agent staurosporine (Figures E, F, G, H) or left untreated (Figures A, B, C, D). pSIVA–IANBD+ PI were added to the media according to kit instructions. Cells were imaged post treatment with the ZOE Fluorescent Cell Imager at 0 minutes, 60 minutes, 120 minutes and 270 minutes. Images A-H are merged images of the red and green fluorescence channels. Early apoptotic cells were stained with pSIVA-IANBD and are shown in green while late apoptotic/dead cells were stained with PI and are shown in red.
Order your pSIVA™ Real-Time Apoptosis Fluorescent Microscopy Kit
You may also be interested in
References:
- Elmore S (2007). Apoptosis: A Review of Programmed Cell Death. Toxicol Pathol. 35(4), 495-516.
- Chipuk JE et al. (2006). Mitochondrial outer membrane permeabilization during apoptosis: the innocent bystander scenario. Cell Death and Differentiation 13, 1396-1402.
- Van der Mark V (2013). P4 ATPases: Flippases in Health and Disease. Int J Mol Sci. 14, 7897-7922.
- Kim et al. (2010 a). Engineering a polarity-sensitive biosensor for time-lapse imaging of apoptotic processes and degeneration. Nature Methods 7(1), 67-73.
- Kim et al. (2010 b). Monitoring apoptosis and neuronal degeneration by real-time detection of phosphatidylserine externalization using a polarity-sensitive indicator of viability and apoptosis. Nature Protocols 5, 1396-1405.