-
US | en
- Products
- Applications
- Flow Cytometry
- Flow Cytometry Explained
- Flow Cytometry Basics Guide
- Chapter 1 - Principles of the Flow Cytometer
- Signal and Pulse Processing

Signal and Pulse Processing
Any time a particle passes through the interrogation point and generates a signal a pulse is generated in every detector. These pulses reflect the passage of the particle through the laser beam or beams and the signal generated at each point in the cell’s path. These pulses can be mapped by plotting signal as a function of time.
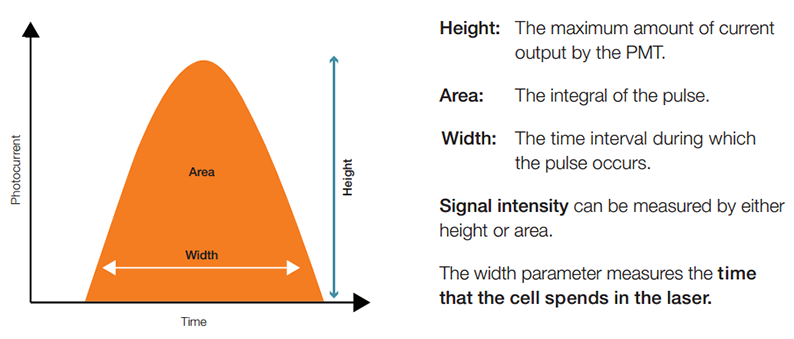
As the particle enters the laser beam spot, it will generate scattered light and fluorescence signals, which will ultimately manifest in a stream of electrons (current) from the anode of the PMT. The magnitude of the current is proportional to the number of photons that hit the photocathode and thus is also proportional to the intensity of the scatter or fluorescence signal generated by the particle. As the particle enters the laser beam spot, the output of the PMT will begin to rise, reaching peak output when the particle is located in the center of the laser beam (Figure 4).

Fig. 4. Quantifying the pulse by measuring its height, area, and width
At this point, the particle is fully illuminated (the laser beam’s photons are at highest density in the center of the laser beam focus) and will produce a maximum amount of optical signal. As the particle flows out of the laser beam the current output of the PMT will drop back to baseline. This generation of a pulse is termed an “event”.
Threshold Setting
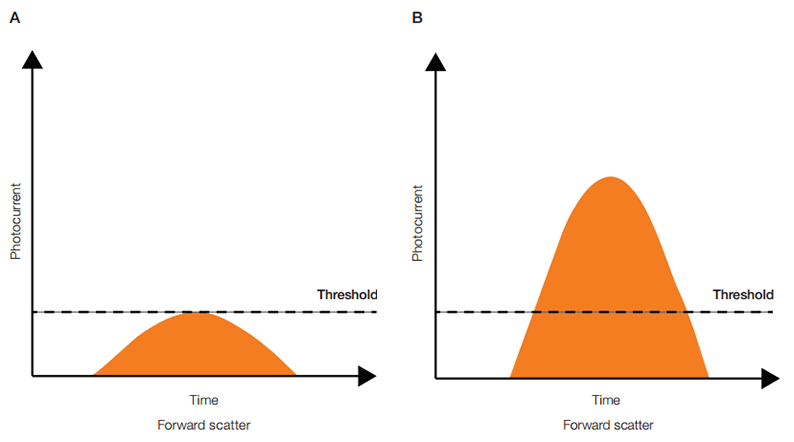
However not all signals that are generated correspond to a particle of interest. To avoid the processing of unwanted signals a decision is made upon the signal intensity (threshold) of a dedicated detector, the trigger channel. This determination is made based upon the trigger parameter and threshold level. PMTs are extremely sensitive and detect signal from a variety of sources that are irrelevant to experimental data including stray light, dust, very small particles and debris. The number of these pulses in the system can be orders of magnitude higher than the number of pulses that are generated by experimental particles. Including these in the dataset would give high levels of background and substantially mask out relevant data points and overload the electronic's ability to process relevant signals. Therefore it is desirable and necessary to have a threshold below which non-essential data is not detected. This is done by designating a parameter as the trigger for recording events, usually forward scatter, and setting a level in that parameter as the threshold. Any pulse that fails to exceed the threshold level is ignored in all detectors (Figure 5A); any pulse that surpasses the threshold level is fully processed by the electronics (Figure 5B).

Fig. 5. Determining whether a pulse is ignored (A) or fully processed (B).
As the pulses are generated, their quantification is necessary for fluorescence signals to be displayed on plots, analyzed and interpreted. This is the job of the signal processing electronics. The majority of flow cytometers are now digital systems. The analog current from the PMT is first digitized or broken down into very small slices by the analog to digital converter (ADC). This process is called “sampling”. A sample of a pulse captures the signal at an instant in time and stores it as a digital value. Together these samples represent the entire pulse and optical signal from the particle.
The electronics quantify the entire pulse by calculating its height, area and width. The height and area, or maximum and integral, respectively, are used to measure signal intensity because their magnitudes are proportional to the number of photons that interacted with the PMT. The width, on the other hand, is proportional to the time that the particles spent in the laser and can be used to distinguish between single particles or closely interacting particles and doublets (this will be discussed later).
Displaying the Data
Although data is collected in a linear scale, data display is usually log scale for fluorescence studies because it expands weak signals and compresses strong signals, resulting in a distribution that is easy to display on a histogram. Linear display is required when very small differences in fluorescence signal must be assessed, for example in DNA analysis where there may only be a two fold increase in fluorescence.
The measurement from each detector is referred to as a parameter. Each parameter can be displayed in height, area and width values on the histograms and dot plots in flow cytometry software. These are used to measure fluorescence intensity, compare populations and designate sorting decisions.
