
Multicolor Immunophenotyping Applications: High-Parameter Panels in Practice
Introduction
This page is part of Bio-Rad's Flow Cytometry Applications content, which covers the full range of ways flow cytometry is used in research and diagnostics—from immunophenotyping to exosome detection, stem cell analysis, and beyond. Here, we focus specifically on multicolor immunophenotyping in practice—real-world use cases, a worked high-parameter panel example, and the tools used to design one.
New to immunophenotyping, or looking for panel design fundamentals, marker tables, and basic gating?
Start with the Flow Cytometry Immunophenotyping guide chapter; this page picks up from there.
Why Researchers Are Moving Toward High-Parameter Immunophenotyping
Traditional flow cytometry experiments often focus on a limited number of cellular markers. However, immune systems are highly complex and consist of numerous interacting cell populations that may differ only subtly in marker expression.
High-parameter immunophenotyping enables researchers to:
- Characterize more immune populations simultaneously
- Identify rare or previously hidden subpopulations
- Reduce sample consumption
- Minimize experimental variation between panels
- Improve understanding of cellular heterogeneity
- Generate more comprehensive immune profiles
These capabilities have become increasingly important in immuno-oncology, translational medicine, vaccine development, and systems immunology.
Real-World Applications of Immunophenotyping
Immunophenotyping by flow cytometry is used well beyond basic immune subset counting. The same core technique—staining cells with fluorophore-conjugated antibodies against surface or intracellular markers and analyzing them by flow cytometry—underpins work across several distinct fields, each with its own panel design priorities.
Immunology research
Profiling immune cell subsets and activation states to study immune cell development, differentiation, function, and response.
Cancer research and diagnostics
Identifying and monitoring malignant leukocyte populations and tumor-infiltrating immune cells, including checkpoint inhibitor response, immune exhaustion profiling, and monitoring CAR T-cell therapy efficacy.
Infectious disease and vaccine research
Assessing immune responses to infection and vaccination, including identification of protective immune signatures and monitoring of memory populations.
Stem cell biology
Characterizing stem and progenitor cell populations, monitoring lineage commitment, and evaluating differentiation—including posttransplant immune reconstitution.
Rheumatology
Investigating immune cell involvement in autoimmune and inflammatory joint disease.
Clinical diagnostics
Supporting diagnosis of immunological dysfunction, including HIV monitoring via CD4/CD8 T cell counts.
Case Study: A 27-Color Immunophenotyping Panel
To show what a high-parameter panel looks like in practice, the example below uses StarBright™ Dyes across 27 parameters on red-blood-cell-lysed peripheral blood, resolving lymphocyte, T-cell, B-cell, NK-cell, monocyte, and granulocyte populations from a single tube.
Target |
ZE5 Cell Analyzer Target Laser: Filter |
Fluorophore |
Antibody Catalog Number* |
|---|---|---|---|
|
HLA DP DQ DR |
355: 387/11 |
SBUV400 |
|
|
CD20 |
355: 509/24 |
SBUV510 |
|
|
CD33 |
355: 577/15 |
SBUV575 |
|
|
Live/dead |
355: 615/24 |
PI |
|
|
CD163 |
355: 670/30 |
SBUV665 |
|
|
CD28 |
355: 747/33 |
SBUV740 |
|
|
CD62L |
355: 780LP |
SBUV795 |
|
|
CD56 |
405: 420/10 |
BV421 |
BioLegend, 318327 |
|
CD24 |
405: 460/22 |
SBV440 |
|
|
CD45RA |
405: 525/50 |
SBV515 |
|
|
CD45RO |
405: 615/24 |
SBV610 |
|
|
CD40 |
405: 670/30 |
SBV670 |
|
|
CD2 |
405: 720/50 |
SBV710 |
|
|
CD14 |
405: 750LP |
SBV790 |
|
|
CD57 |
488: 525/35 |
FITC |
|
|
CD3 |
488: 593/52 |
SBB580 |
|
|
CD11b |
488: 692/80 |
SBB700 |
|
|
HLA ABC |
488: 750LP |
SBB810 |
|
|
CD10 |
561: 583/30 |
SBY575 |
|
|
CD4 |
561: 615/24 |
SBY605 |
|
|
CD45 |
561: 670/30 |
SBY665 |
|
|
CD27 |
561: 720/60 |
SBY720 |
|
|
CD38 |
561: 750/LP |
SBY800 |
|
|
CD16 |
640: 670/30 |
A647 |
|
|
CD31 |
640: 720/60 |
A700 |
MCA1738A700 |
|
CD19 |
640: 775/50 |
SBR775 |
|
|
CD8 |
640: 800LP |
SBR815 |
Initial Plots

Fig. 1. 27-color multiplex panel. Red blood cell lysed human peripheral blood was stained with a live/dead dye (propidium iodide, (PI)) and a 26-color antibody panel in FACS Buffer, enabling identification of multiple cell lineages and subsets.
Full Gating Strategy
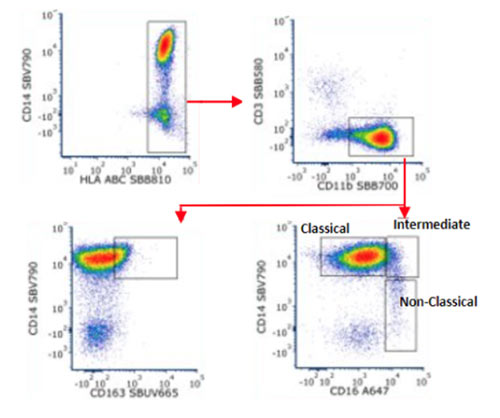
Each step below narrows the population from whole leukocytes down to a specific immune subset, using the 27-color panel detailed above.
- Lymphocytes—gated from whole leukocytes on the basis of forward and side scatter to exclude debris, doublets, and granulocytes/monocytes at this stage.
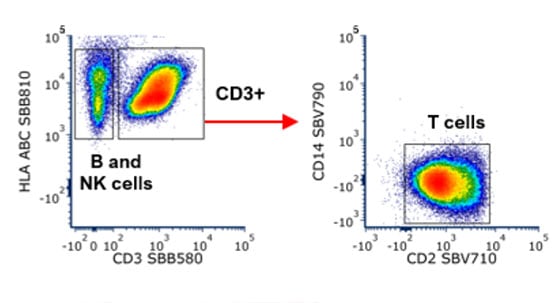
- CD3+ T cells—gated from the lymphocyte population using CD3 expression to separate T cells from B cells and NK cells.
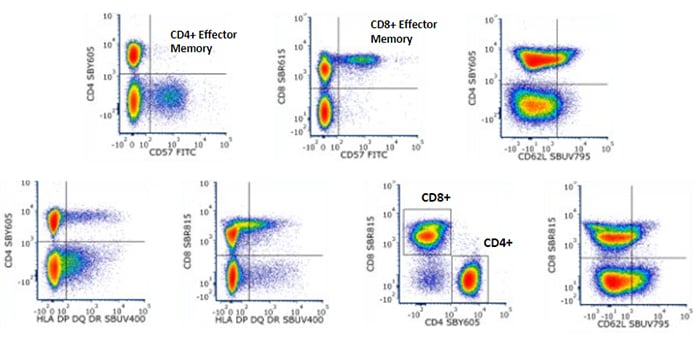
- Cytotoxic and T helper cells—CD3+ T cells further resolved into CD8+ cytotoxic T cells and CD4+ T helper cells.
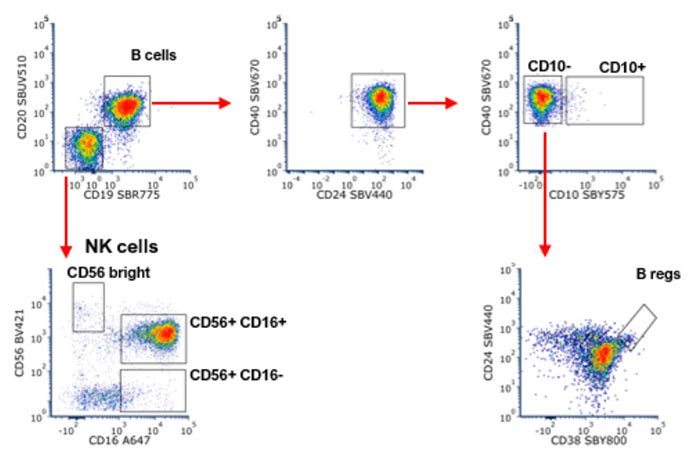
- B cells and NK cells—the CD3-negative lymphocyte fraction resolved using CD19 (B cells) and CD16/CD56 (NK cells).
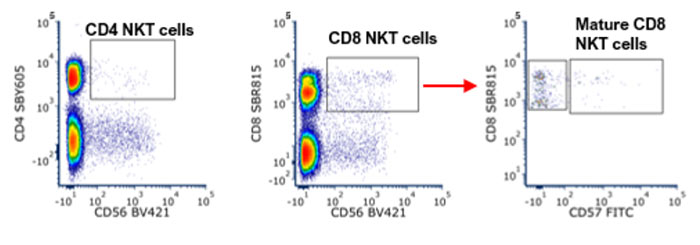
- NKT cells—identified from the CD3+ population co-expressing NK markers, distinguishing them from conventional T cells and NK cells.
- Monocytes—identified from the non-lymphocyte fraction using CD14 expression and characteristic scatter properties.
- Granulocytes—resolved using high side-scatter signal and characteristic scatter properties distinguishing them from monocytes.
Lymphocytes
CD3+ T Cells
Cytotoxic and T Helper Cells

B and NK Cells
NKT Cells
Monocytes
Granulocytes
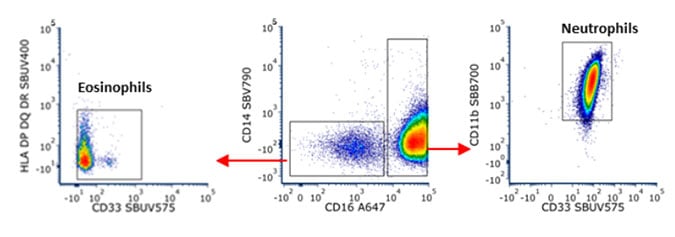
Fig. 2. Full gating strategy of the 27-color multiplex panel. Red blood cell lysed human peripheral blood was stained with PI and a 26-color antibody panel (Table 1) for the identification of multiple cell lineages and subsets.
Speed Without Sacrificing Data Quality
High-parameter panels are only practical at scale if acquisition keeps pace. On the ZE5 Cell Analyzer, a full 96-well plate can be processed in under 15 minutes while still collecting 100,000 events per well.
The ZE5 Cell Analyzer was designed to support demanding multiparametric applications through:

- Up to five lasers
- Detection of up to 30 parameters (this page's example panel uses 27)
- Flexible optical configurations
- Automated quality control
- Automated 96-well plate acquisition
To demonstrate this speed advantage, we repeated the 27-color panel shown above using high-throughput mode for sample acquisition.
The data shows a high level of reproducibility between high-throughput runs and are consistent with standard mode runs.
While data quality was preserved, the run time for each well was reduced from 3 minutes 21 seconds in standard mode, to 8 seconds in high-throughput mode.
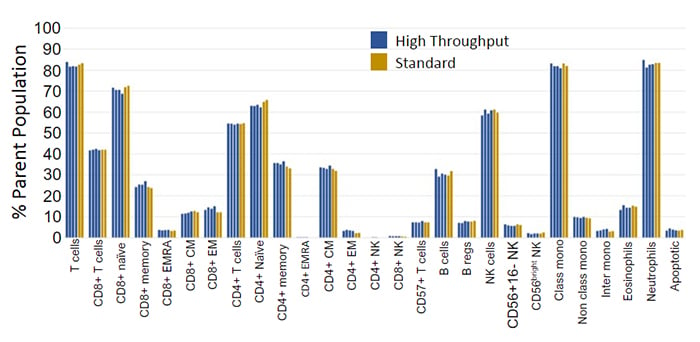
Fig. 3. Example 27-color panel comparison of standard and high-throughput data acquisition. This example shows six replicates of the 27-color panel data shown previously, a single sample was collected in high throughput (n=4) and standard mode (n=2). Each standard mode replicate was collected in 3 minutes and 21 seconds, while each high throughput mode replicate was collected in 8 seconds.
Table 2. ZE5 Cell Analyzer: Standard vs. high-throughput acquisition.
| Acquisition Mode | Time per Well | Data Quality |
|---|---|---|
| Standard mode | 3 min 21 sec | Baseline resolution and population structure |
| High-throughput mode | 8 sec | Resolution and population structure preserved vs. standard mode |
Want Help Designing a High-Parameter Immunophenotyping Panel for Your Instrument?
Tools to Design Your Own Panel
- Spectraviewer—check fluorophore compatibility and spectral overlap before you order antibodies
- Panel Builder—design an instrument-specific multicolor panel based on your cytometer's configuration
- Custom Free Flow Cytometry Panel Building Service—get hands-on panel design assistance from Bio-Rad's flow cytometry team
For guidance on the underlying design principles—fluorophore brightness, marker co-expression, and control selection—see the guide's Multicolor Panel Design Considerations section.
StarBright Dye Panel Posters
 StarBright Dyes: Excitable by the Blue & Yellow Lasers
11-color panels introducing StarBright Blue and StarBright Yellow Dyes on the ZE5 Cell Analyzer.
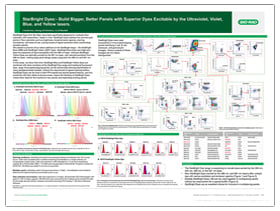 StarBright Dyes: Excitable by the UltraViolet, Violet, Blue & Yellow Lasers
23-color panel built using only antibodies from Bio-Rad and the ZE5 Cell Analyzer.
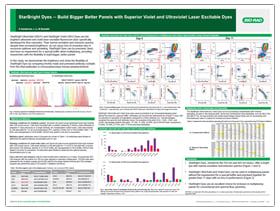 StarBright Dyes: Excitable by Violet & Ultraviolet Lasers
Poster comparing the stain index of StarBright Dyes to dyes from other vendors, and the effect of pre-mixing antibody cocktails containing StarBright Violet and UltraViolet Dyes compared to freshly made up cocktails.
 StarBright Dyes & the ZE5 Cell Analyzer: Generating Fast, Reproducible, High Resolution Flow Cytometry Data
27-color panel built using StarBright Ultraviolet, Violet, Blue, Yellow, and Red Dyes and assayed using the ZE5 Cell Analyzer. This poster demonstrates the stability of premixed StarBright Dyes over 6 months and the excellent data reproducibility achieved when performing complex immunophenotyping at high speed
Further Reading: Applied Panels
- Quantification of T Cell Subsets in Stem Cell Transplant Patients Using a 21-Color Panel
- A 19-Color Panel for the Immunophenotyping of Normal and Malignant Leukocytes by Flow Cytometry
Frequently Asked Questions
Is flow cytometry the only method used for immunophenotyping?
No. Flow cytometry is the most widely used technique because it measures many markers per cell, at single-cell resolution, at high speed—which is why the rest of this page focuses on it—but immunophenotyping can also be performed by microscopy-based imaging or by single-cell RNA sequencing, which classifies cells by gene expression rather than by surface or intracellular protein markers. Each approach trades off differently on throughput, resolution, and the type of data produced, and flow cytometry remains the standard choice when speed and multiplexed protein-level detection matter most.
How many colors can a modern flow cytometry immunophenotyping panel include?
Panels of 20 or more colors are achievable on suitable instruments—this page walks through a worked 27-color example. For guidance on typical panel sizes and when each is appropriate, see the panel size overview in the Immunophenotyping guide chapter.
How fast can a high-parameter immunophenotyping panel be acquired?
On the ZE5 Cell Analyzer, a 27-color panel across a full 96-well plate can be acquired in under 15 minutes in high-throughput mode (as fast as 8 seconds per well), while preserving the resolution and population structure seen in standard-mode acquisition.
What do I need to design a 20+ color immunophenotyping panel?
Start with the fluorophore compatibility and marker expression considerations covered in the Immunophenotyping guide chapter, then use the Spectraviewer to check spectral overlap and Panel Builder to design against your specific instrument configuration. Bio-Rad's Custom Free Flow Cytometry Panel Building Service is also available for hands-on design support.
Is spectral flow cytometry the same as high-parameter immunophenotyping?
Not exactly. High-parameter panels can be run on either conventional or spectral cytometers; spectral instruments use full-spectrum detection rather than discrete filters, which can further improve resolution of highly overlapping dyes in very large panels.
Be the First to Receive Updates on Products and Resources
You'll receive regular communications featuring free lab resources such as application guides, posters, mini-reviews, protocols, practical tips, webinar invitations, special offers, and updates on new research tools and products.
You'll also get our specialist newsletters—including Fab Fragments, Flow. Sorted., and RiVETing—along with news on the latest antibody innovations, such as TrailBlazer™ Antibodies and StarBright™ Dyes.
During sign-up, you can choose your areas of interest so you only receive content relevant to your research, and you can unsubscribe at any time.
