How to Get More Out of Your Multicolor Panels
- Mar 13, 2018
- 4 min read
- Kimberley Bryon-Dodd, PhD
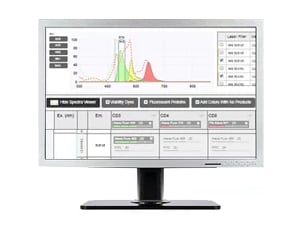
Designing multicolor panels for flow cytometry experiments can be a time-consuming process. The more markers you wish to include in your panel, the more difficult it is to find compatible fluorophores. Experimental design can also be limited by the range of available fluorophores for your marker, the limitations of your flow cytometer and the abundance of your marker. Our new panel builder tool simplifies this process and enables you to quickly and easily build complicated panels.
Our short video tutorial explains how to optimize the use of the panel builder tool. As well as finding compatible fluorophores for your experiment, the tool has the capability to factor in best practices in flow cytometry such as optimizing for antigen density, using a dump channel and adding a viability dye. A more in-depth description of why you should consider including these best practices in your panel is discussed below.
Optimize for Antigen Density
Choosing your fluorophores carefully can help with the resolution that you obtain from your experiments. To get the best results, you should take the density and expression patterns of your markers into consideration when deciding which fluorophores are the most appropriate to use (Figure 1). Phycoerythrin (PE) is regarded as the gold-standard for brightness with other fluorophores having varying brightness compared to PE (Maciorowski et al. 2017).

Fig. 1. Antigen Density. Human peripheral blood was stained for CD45RA PE, CD5 PE and CD56 PE to show how the number of antigens correlates to the fluorescence intensity of the positive population.
As a general rule it is best to save your brightest fluorophores for your weakest markers and use dimmer fluorophores (for instance Pacific Blue) for your most abundant markers. Each fluorophore has a maximum excitation wavelength but can also be excited across a range of wavelengths, with lower efficiency (Maciorowski et al. 2017). Keep in mind that if you use a bright fluorophore (for instance PE) for a strongly expressed marker, you may run the risk of increased spillover into adjacent channels (Figure 2) that could mask the signal from markers in those adjacent channels (Perfetto et al. 2004).

Fig. 2. Fluorescence spillover. Emission spectra of fluorophores used in flow cytometry, PE (yellow), PE-Alexa 610 (orange) and PE-Cyanine 5 (red) are shown with a graphical representation of common filters used when detecting these fluorophores. Spillover from one fluorophore into another channel can be clearly seen.
Use Dump Channels to Exclude Cell Populations
A dump channel is a way of removing all of the unwanted cells in a sample by placing them in a channel that will be ignored (Perfetto et al. 2004). This can be especially useful when studying rare populations, such as stem cells, or in vaccine development as immune system cells of interest may only comprise a very small proportion of the T cells (Perfetto et al. 2004). You can use a fluorophore conjugated to antibodies that are expressed on cells that you wish to exclude but not expressed on the cells that you are interested in (Figure 3). This means that any unwanted binding or fluorescence spillover and spread caused by those cells will also be removed from your analysis.

Fig. 3. Using a dump channel to identify B cells. A, lymphocytes were identified by forward scatter (FSC) and side scatter (SSC). B, Alexa Fluor 700 (A700) labeling was used to exclude T cells (CD3), NK cells (CD56) and monocytes (CD14). B cells were identified as CD19 positive and CD3, CD14 and CD56 negative.
Viability Dyes Improve Your Analysis
The quality of your data can be greatly affected by dead or dying cells in your sample (Perfetto et al. 2004). Dead/dying cells have greater autofluorescence and will bind to antibodies non-specifically, leading to false positives. This increased non-specific binding of antibodies will also reduce the resolution as the background is increased. These factors can make identification of rare populations and weakly positive populations difficult. Although using gates based on forward and side scatter can help remove some of this noise, it is best practice to use a viability dye to exclude dead cells from your analysis.
There are two types of viability dyes available.
Nucleic acid binding dyes bind to double stranded nucleic acid and fluoresce. As they are not membrane permeable they do not stain live cells. Therefore gating on the unstained population will allow you to remove the dead cells from analysis. Examples of nucleic acid binding dyes include propidium iodide (PI) and 7-AAD.
Protein binding dyes, such as VivaFix™ Cell Viability Assay, bind to both live and dead cells but dead cells will have a stronger signal due to compromised membranes allowing the dye access to intracellular proteins. The dead cells can then be excluded by gating the less stained population for instance the live cells (Figure 4). In addition to being available in a wide range of excitation and emission spectra, these dyes can also be fixed with no loss of fluorescence giving you more time to analyze your samples.

Fig. 4. VivaFix Cell Viability Assay. Jurkat cells were stained with the VivaFix 498/521 Cell Viability Assay fixed with 3.7% formaldehyde (A) or not fixed (B), and analyzed with the S3™ Cell Sorter. SSC, side scatter.
New to Flow Cytometry?
Take a look at our Flow Cytometry Basics Guide for top tips on getting started and troubleshooting. Our dedicated flow cytometry resources page has links to webinars, reagents, kits and a variety of resources to help you get the most out of your experiments.
References
Maciorowski Z et al (2017) Basic Multicolor Flow Cytometry Curr Protoc Immunol. 117:5.4.1-5.4.38.
Perfetto SP et al. (2004). Seventeen-colour flow cytometry: unravelling the immune system. Nat Rev Immunol 4, 648–655.