
A Guide to Gating in Flow Cytometry
- Dec 16, 2016
- 4 min read
- Annalise Barnette, PhD
Flow cytometry analysis typically begins with creating gates to distinguish cells of interest. This process of gating can appear quite random to a flow cytometry novice but it is in fact the most important part of flow cytometry analysis.
So what gating methods do you need to know to confidently analyze your stained samples? This blog post will take you through the various gating strategies for effective flow cytometry analysis.
Learn as much as possible about your cells of interest
Your gating strategy is informed by what you know about your cells of interest. Therefore, before you begin your analysis, it is important to first find out as much as possible about the cells you are analyzing. Things to determine are the relative expression levels of cell specific markers, the approximate size of the cells, and whether their size can be affected by experimental conditions. For example, the fixation and permeabilization processes during intracellular staining can alter cell size and granularity, resulting in modified forward and side scatter profiles (discussed below). If you have no prior experience with your cells of interest, it is important to check the literature as a guide. Before beginning, you should also ensure that you include proper controls for accurate data analysis. Our recent webinar on flow cytometry controls provides information on what controls to include in your experiment.
Forward and side scatter density plots for identifying your cell population of interest and excluding debris
Forward versus side scatter (FSC vs SSC) gating is commonly used to identify cells of interest based on size and granularity (complexity). It is often suggested that forward scatter indicates cell size whereas side scatter relates to the complexity or granularity of the cell. However, it should be noted that forward scatter does not necessarily relate to size and side scatter is not really granularity. While these are an indication based on light refraction, it depends on the sample, the sheath fluid and the laser wavelength. For example, FSC vs SSC gating is most useful for blood samples but even then, granulocytes (12-17 μm) can sometimes appear larger than monocytes (20-25 μm). Furthermore, for small samples, the level of light scatter does not always correlate with size.
Despite these caveats, in samples with multiple cell types, this first level gating method is useful for identifying the cells of interest. Figure 1 shows how FSC vs SSC gating can be used to identify the distinct cell types in red cell lysed whole blood.
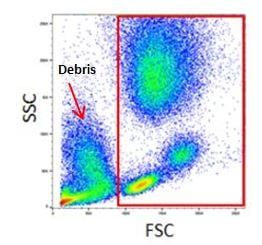
This gating strategy can also be used to exclude debris as they tend to have lower forward scatter levels. They are often found at the bottom left corner of the FSC vs SSC density plot (Figure 2).
When gating, bear in mind that blasting cells may be larger than resting cells; therefore, tight gates may mean you are missing a population that is important to your experiment. In this case using a viability dye to remove debris and dead cells may be useful, as would backgating (discussed below), to identify cells that fall outside of the gates. Also, for some samples such as blood or bone marrow, gating on SSC vs CD45 or other markers might help identify the cells you need.
Essentially, it is important to play around with the data and check everything, as your cells may not be where you think they are.
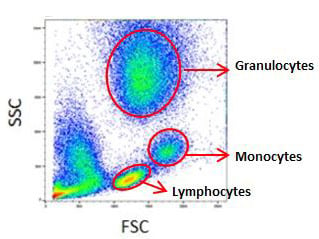
Fig. 1. Forward and side scatter plot of red cell lysed whole blood
Forward scatter height versus forward scatter area density plot for doublet exclusion
Doublet cells can significantly affect your analysis and could lead to inaccurate conclusions. A forward scatter height (FSC-H) vs. forward scatter area (FSC-A) density plot can be used to exclude doublets as shown in Figure 3 below. A side scatter height (SSC-H) vs side scatter area (SSC-A) plot can also be used. This type of gating can be more sensitive for doublet exclusion as the FSC detector is not usually a photomultiplier tube (PMT).
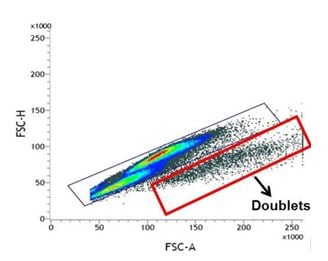
Fig. 3. FSC-H vs FSC-A plot for doublet
Single parameter histograms for identifying cells with a particular marker expression
Single parameter histograms can be used to further identify distinct cell types that express a particular marker in a specific population of cells. For example, after gating for lymphocytes on red cell lysed whole blood (Figure 1), a CD3 single parameter histogram can be generated to identify CD3 expressing cells (Figure 4). In addition, this type of plot can also be used to easily exclude dead cells. If cells are stained with a viability dye such as propidium iodide or 7-AAD, a single parameter histogram can be used to identify dead cells which would be positive for the dye.
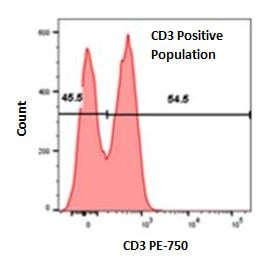
Fig. 4. Single parameter histogram using red cell lysed whole blood previously gated on lymphocyte population
Two parameter density plots for further analysis
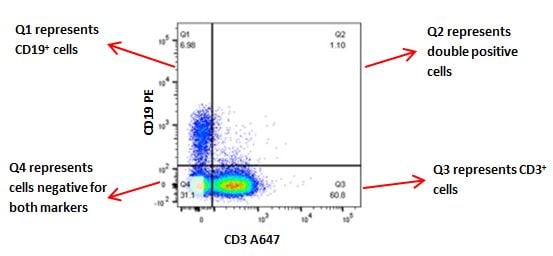
Two parameter density plots in which each axis represents a particular marker that your samples have been stained for can be used to further analyze your samples. For example, after gating on a lymphocyte gate on whole blood as in figure 1, a two-parameter density blot can be used to distinguish T cells and B cells by creating a plot on CD3 vs CD19 (Figure 5).
Backgating
Backgating is a common method for confirming a staining pattern or gating method. This can be useful for getting additional information to identify your cells if you are unsure of your gates, the expression levels or your cells, or whether dead cells have been included in your analysis.
Using the above gating methods, you now should be able to confidently analyze your cells and make accurate conclusions based on your flow cytometry analysis.
Learn more about gating and see a full length gating example.
Try Our Interactive Panel Builder Tool
Easily build complex multicolor flow cytometry panels in just a few simple steps.
Additional Flow Cytometry Resources
We have a range of resources to help you master other aspects of flow cytometry include the Introduction to Flow Cytometry- Basics guide, webinar on optimizing your flow cytometry and our previous blog post discussing the 5 easy steps for successful flow cytometry results.